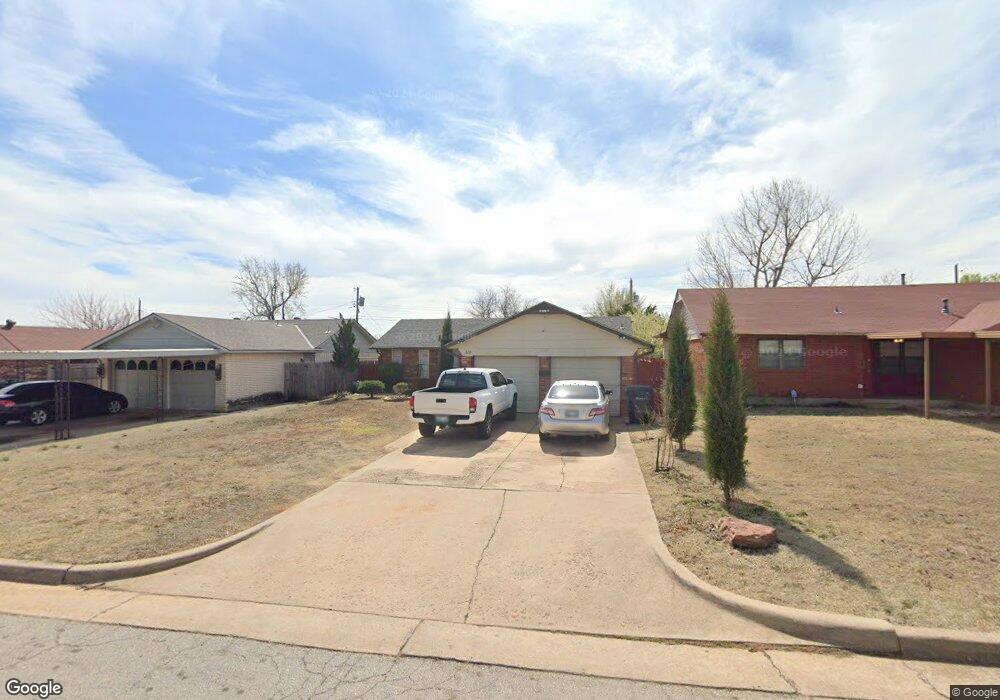
228 NW 87th St Oklahoma City, OK 73114
North Highland NeighborhoodEstimated Value: $126,613 - $138,000
3
Beds
2
Baths
1,030
Sq Ft
$127/Sq Ft
Est. Value
About This Home
This home is located at 228 NW 87th St, Oklahoma City, OK 73114 and is currently estimated at $131,153, approximately $127 per square foot. 228 NW 87th St is a home located in Oklahoma County with nearby schools including Britton Elementary School, John Marshall Enterprise Middle School, and John Marshall Enterprise High School.
Ownership History
Date
Name
Owned For
Owner Type
Purchase Details
Closed on
Sep 30, 2018
Sold by
Flehman Properties Inc
Bought by
Flores Margarito Martinez and Hernandez Crecencia
Current Estimated Value
Home Financials for this Owner
Home Financials are based on the most recent Mortgage that was taken out on this home.
Original Mortgage
$47,000
Outstanding Balance
$29,192
Interest Rate
4.5%
Mortgage Type
Purchase Money Mortgage
Estimated Equity
$101,961
Purchase Details
Closed on
Jan 15, 2009
Sold by
Slater Margie D and M D L S Family Trust
Bought by
Fleshman Properties Inc
Create a Home Valuation Report for This Property
The Home Valuation Report is an in-depth analysis detailing your home's value as well as a comparison with similar homes in the area
Home Values in the Area
Average Home Value in this Area
Purchase History
| Date | Buyer | Sale Price | Title Company |
|---|---|---|---|
| Flores Margarito Martinez | $52,000 | None Available | |
| Fleshman Properties Inc | -- | None Available |
Source: Public Records
Mortgage History
| Date | Status | Borrower | Loan Amount |
|---|---|---|---|
| Open | Flores Margarito Martinez | $47,000 |
Source: Public Records
Tax History Compared to Growth
Tax History
| Year | Tax Paid | Tax Assessment Tax Assessment Total Assessment is a certain percentage of the fair market value that is determined by local assessors to be the total taxable value of land and additions on the property. | Land | Improvement |
|---|---|---|---|---|
| 2024 | $845 | $7,229 | $1,398 | $5,831 |
| 2023 | $845 | $6,884 | $1,412 | $5,472 |
| 2022 | $771 | $6,557 | $719 | $5,838 |
| 2021 | $735 | $6,245 | $881 | $5,364 |
| 2020 | $708 | $5,948 | $941 | $5,007 |
| 2019 | $674 | $5,665 | $1,001 | $4,664 |
| 2018 | $624 | $5,500 | $0 | $0 |
| 2017 | $695 | $6,131 | $910 | $5,221 |
| 2016 | $662 | $5,839 | $923 | $4,916 |
| 2015 | $637 | $5,561 | $939 | $4,622 |
| 2014 | $633 | $5,561 | $962 | $4,599 |
Source: Public Records
Map
Nearby Homes