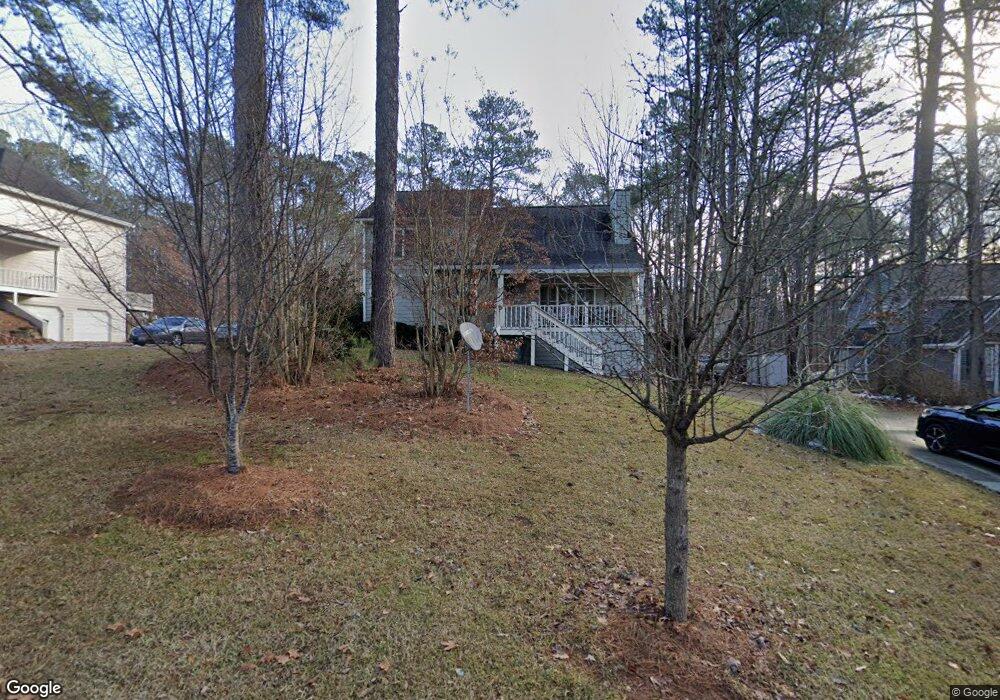
228 Picketts Mill Run Acworth, GA 30101
Cedarcrest NeighborhoodEstimated Value: $369,000 - $423,000
4
Beds
3
Baths
2,140
Sq Ft
$183/Sq Ft
Est. Value
About This Home
This home is located at 228 Picketts Mill Run, Acworth, GA 30101 and is currently estimated at $391,566, approximately $182 per square foot. 228 Picketts Mill Run is a home located in Paulding County with nearby schools including Roland W. Russom Elementary School, East Paulding Middle School, and North Paulding High School.
Ownership History
Date
Name
Owned For
Owner Type
Purchase Details
Closed on
Apr 28, 2006
Sold by
Household Rlty
Bought by
Tromp Oscar B and Tromp Cynithia A
Current Estimated Value
Home Financials for this Owner
Home Financials are based on the most recent Mortgage that was taken out on this home.
Original Mortgage
$14,500
Outstanding Balance
$8,364
Interest Rate
6.33%
Mortgage Type
Stand Alone Second
Estimated Equity
$383,202
Purchase Details
Closed on
Dec 6, 2005
Sold by
Lutman Michael
Bought by
Household Mtg Fndg Corp Iii
Create a Home Valuation Report for This Property
The Home Valuation Report is an in-depth analysis detailing your home's value as well as a comparison with similar homes in the area
Home Values in the Area
Average Home Value in this Area
Purchase History
| Date | Buyer | Sale Price | Title Company |
|---|---|---|---|
| Tromp Oscar B | -- | -- | |
| Household Rlty | $145,200 | -- | |
| Household Mtg Fndg Corp Iii | $116,057 | -- |
Source: Public Records
Mortgage History
| Date | Status | Borrower | Loan Amount |
|---|---|---|---|
| Open | Household Rlty | $14,500 |
Source: Public Records
Tax History Compared to Growth
Tax History
| Year | Tax Paid | Tax Assessment Tax Assessment Total Assessment is a certain percentage of the fair market value that is determined by local assessors to be the total taxable value of land and additions on the property. | Land | Improvement |
|---|---|---|---|---|
| 2024 | $3,683 | $151,280 | $14,000 | $137,280 |
| 2023 | $4,255 | $165,752 | $14,000 | $151,752 |
| 2022 | $3,222 | $125,452 | $14,000 | $111,452 |
| 2021 | $2,860 | $100,276 | $14,000 | $86,276 |
| 2020 | $2,586 | $88,936 | $14,000 | $74,936 |
| 2019 | $2,304 | $78,336 | $14,000 | $64,336 |
| 2018 | $2,354 | $80,012 | $14,000 | $66,012 |
| 2017 | $2,028 | $68,256 | $12,800 | $55,456 |
| 2016 | $1,926 | $65,544 | $12,800 | $52,744 |
| 2015 | $2,086 | $67,788 | $12,800 | $54,988 |
| 2014 | $1,887 | $59,764 | $12,800 | $46,964 |
| 2013 | -- | $54,160 | $12,800 | $41,360 |
Source: Public Records
Map
Nearby Homes
- 3684 Autumn View Dr NW
- 39 Telfair Ct
- 64 Telfair Ct
- 427 Picketts Lake Dr
- 254 Broadstone Blvd
- 3465 Plantation Ridge NW
- 138 Highcrest Dr
- 28 Vandiver Ct
- 71 Vandiver Ct
- 261 Highcrest Dr
- 6206 Cedarcrest Rd NW
- 954 Carl Sanders Dr
- 3917 Dallas Acworth Hwy NW
- 6205 Arnall Ct NW
- 3802 Bayside Passage NW Unit 1
- 4313 Acworth Dallas Rd Lot 2 Dr
- 6335 Howell Cobb Ct
- 123 Candler Loop
- 246 Picketts Mill Run
- 214 Picketts Mill Run
- 246 Pickett's Mill Run
- 3705 Autumn View Dr NW Unit 62
- 3705 Autumn View Dr NW
- 3706 Autumn View Dr NW
- 268 Picketts Mill Run
- 233 Picketts Mill Run
- 249 Pickett's Mill Run
- 249 Picketts Mill Run
- 210 Picketts Mill Run
- 271 Picketts Mill Run
- 302 Picketts Mill Run
- 6356 Autumn View Point NW
- 3704 Autumn View Dr NW
- 6352 Autumn View Pointe NW
- 165 Picketts Mill Run Unit 5
- 3855 Autumn View Dr
- 3699 Autumn View Dr NW
- 190 Picketts Mill Run