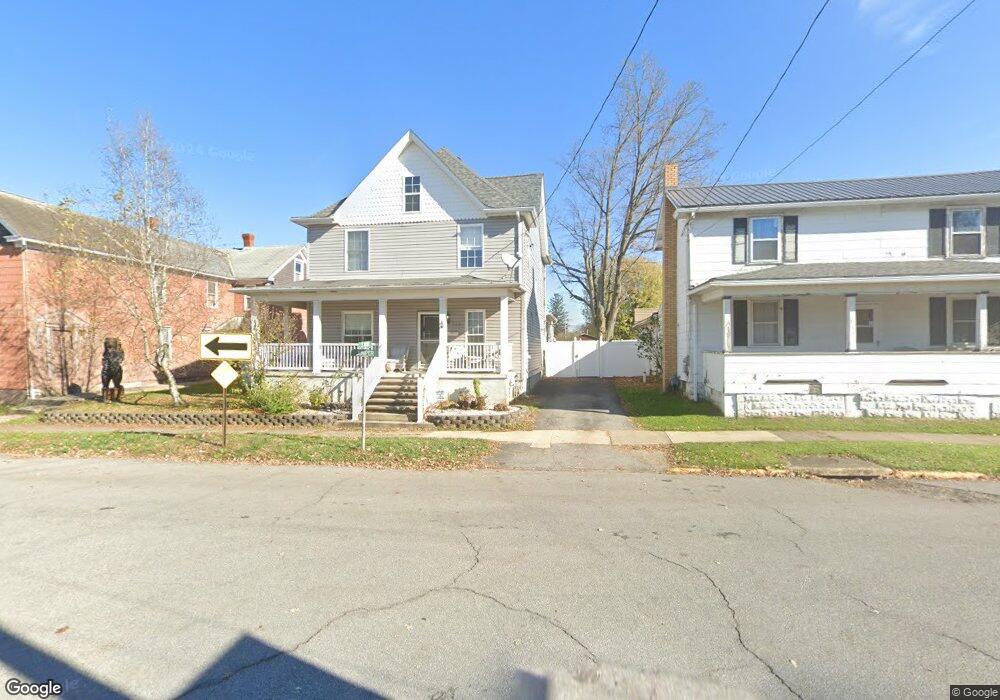
228 S Main St Homer City, PA 15748
Estimated Value: $131,045 - $158,000
3
Beds
1
Bath
1,457
Sq Ft
$102/Sq Ft
Est. Value
About This Home
This home is located at 228 S Main St, Homer City, PA 15748 and is currently estimated at $149,261, approximately $102 per square foot. 228 S Main St is a home located in Indiana County with nearby schools including Homer-Center Elementary School and Homer-Center Junior/Senior High School.
Ownership History
Date
Name
Owned For
Owner Type
Purchase Details
Closed on
Sep 8, 2020
Sold by
Lowman Joshua D and Roddy Nicole W
Bought by
Church Travis and Church Deanna
Current Estimated Value
Home Financials for this Owner
Home Financials are based on the most recent Mortgage that was taken out on this home.
Original Mortgage
$79,290
Outstanding Balance
$70,234
Interest Rate
2.8%
Mortgage Type
New Conventional
Estimated Equity
$79,027
Purchase Details
Closed on
Jan 13, 2016
Sold by
Shimko Joseph M and Shimiko Kathryn J
Bought by
Lowman Joshua D
Home Financials for this Owner
Home Financials are based on the most recent Mortgage that was taken out on this home.
Original Mortgage
$73,641
Interest Rate
3.97%
Mortgage Type
FHA
Purchase Details
Closed on
Sep 17, 2009
Sold by
S & T Bank
Bought by
Shimko Joseph M and Shimko Kathryn J
Purchase Details
Closed on
Jul 31, 2009
Sold by
Miles Michael James and Miles Terri Lynn
Bought by
S & T Bank
Create a Home Valuation Report for This Property
The Home Valuation Report is an in-depth analysis detailing your home's value as well as a comparison with similar homes in the area
Home Values in the Area
Average Home Value in this Area
Purchase History
| Date | Buyer | Sale Price | Title Company |
|---|---|---|---|
| Church Travis | $88,100 | Assured Settlement Solutions | |
| Lowman Joshua D | $75,000 | Attorney | |
| Shimko Joseph M | $36,000 | None Available | |
| S & T Bank | $1,293 | None Available |
Source: Public Records
Mortgage History
| Date | Status | Borrower | Loan Amount |
|---|---|---|---|
| Open | Church Travis | $79,290 | |
| Previous Owner | Lowman Joshua D | $73,641 |
Source: Public Records
Tax History Compared to Growth
Tax History
| Year | Tax Paid | Tax Assessment Tax Assessment Total Assessment is a certain percentage of the fair market value that is determined by local assessors to be the total taxable value of land and additions on the property. | Land | Improvement |
|---|---|---|---|---|
| 2025 | $2,247 | $79,900 | $10,000 | $69,900 |
| 2024 | $2,215 | $79,900 | $10,000 | $69,900 |
| 2023 | $2,098 | $79,900 | $10,000 | $69,900 |
| 2022 | $2,004 | $79,900 | $10,000 | $69,900 |
| 2021 | $2,004 | $79,900 | $10,000 | $69,900 |
| 2020 | $1,968 | $79,900 | $10,000 | $69,900 |
| 2018 | $1,957 | $79,900 | $10,000 | $69,900 |
| 2017 | $1,966 | $79,900 | $10,000 | $69,900 |
| 2016 | -- | $79,900 | $10,000 | $69,900 |
| 2015 | -- | $6,830 | $840 | $5,990 |
| 2014 | -- | $6,830 | $840 | $5,990 |
Source: Public Records
Map
Nearby Homes