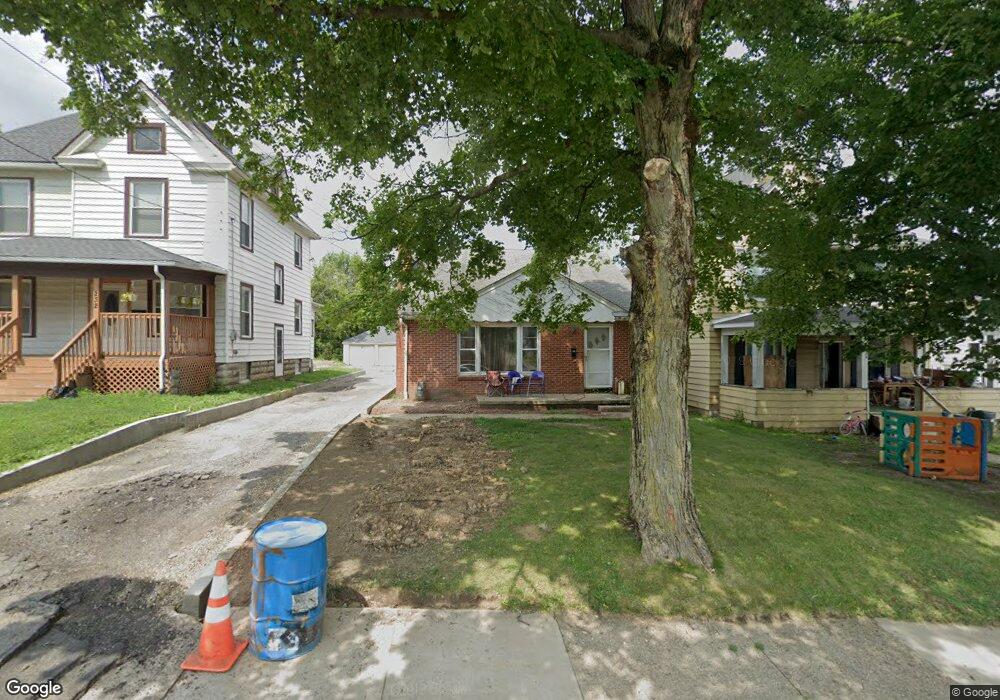
228 S Mulberry St Mansfield, OH 44903
Estimated Value: $81,000 - $132,000
2
Beds
2
Baths
1,247
Sq Ft
$88/Sq Ft
Est. Value
About This Home
This home is located at 228 S Mulberry St, Mansfield, OH 44903 and is currently estimated at $109,498, approximately $87 per square foot. 228 S Mulberry St is a home located in Richland County with nearby schools including St. Peter's Elementary/Montessori School, St. Peter's High School/Junior High, and Discovery School.
Ownership History
Date
Name
Owned For
Owner Type
Purchase Details
Closed on
Nov 26, 1999
Sold by
Walker Pauline and Walker Elston
Bought by
Nagel Ronald H
Current Estimated Value
Home Financials for this Owner
Home Financials are based on the most recent Mortgage that was taken out on this home.
Original Mortgage
$47,955
Outstanding Balance
$15,058
Interest Rate
7.9%
Mortgage Type
FHA
Estimated Equity
$94,441
Purchase Details
Closed on
Feb 22, 1994
Sold by
Finney Dorothy G
Bought by
Elston Pauline Walker
Create a Home Valuation Report for This Property
The Home Valuation Report is an in-depth analysis detailing your home's value as well as a comparison with similar homes in the area
Home Values in the Area
Average Home Value in this Area
Purchase History
| Date | Buyer | Sale Price | Title Company |
|---|---|---|---|
| Nagel Ronald H | $47,500 | -- | |
| Elston Pauline Walker | $37,000 | -- |
Source: Public Records
Mortgage History
| Date | Status | Borrower | Loan Amount |
|---|---|---|---|
| Open | Nagel Ronald H | $47,955 |
Source: Public Records
Tax History Compared to Growth
Tax History
| Year | Tax Paid | Tax Assessment Tax Assessment Total Assessment is a certain percentage of the fair market value that is determined by local assessors to be the total taxable value of land and additions on the property. | Land | Improvement |
|---|---|---|---|---|
| 2024 | $731 | $15,550 | $2,710 | $12,840 |
| 2023 | $731 | $15,550 | $2,710 | $12,840 |
| 2022 | $668 | $11,880 | $2,220 | $9,660 |
| 2021 | $672 | $11,880 | $2,220 | $9,660 |
| 2020 | $687 | $11,880 | $2,220 | $9,660 |
| 2019 | $762 | $11,880 | $2,220 | $9,660 |
| 2018 | $752 | $11,880 | $2,220 | $9,660 |
| 2017 | $701 | $11,880 | $2,220 | $9,660 |
| 2016 | $670 | $10,540 | $2,560 | $7,980 |
| 2015 | $1,262 | $20,860 | $2,560 | $18,300 |
| 2014 | $1,246 | $20,860 | $2,560 | $18,300 |
| 2012 | $1,148 | $20,860 | $2,690 | $18,170 |
Source: Public Records
Map
Nearby Homes
- 96 Glenwood Heights
- 186 S Mulberry St
- 212 S Main St
- 286 S Main St
- 137 Lexington Ave
- 259 S Main St
- 37 W Arch St
- 120 Grover St
- 172 -172 1 2 Lexington Ave
- 353 Sturges Ave
- 188 S Franklin Ave
- 217 S Franklin Ave
- 131 Sturges Ave
- 375 Sturges Ave
- 327 Hammond Ave
- 394 S Main St
- 257 Wood St
- 0 Cline Ave Hedeen Abbeyfeale Unit 9066362
- 319 Altamont Ave
- 116 W 2nd St
- 224 S Mulberry St
- 232 S Mulberry St
- 220 S Mulberry St
- 234 S Mulberry St
- 216 S Mulberry St
- 97 Glenwood Heights
- 103 Glenwood Heights
- 240 S Mulberry St
- 240 S Mulberry St
- 240 S Mulberry St
- 88 Glenwood Heights
- 212 S Mulberry St
- 248 S Mulberry St
- 109 Glenwood Heights
- 117 Glenwood Heights
- 92 Glenwood Heights
- 229 N St
- 254 S Mulberry St
- 206 S Mulberry St
- 231 S Mulberry St