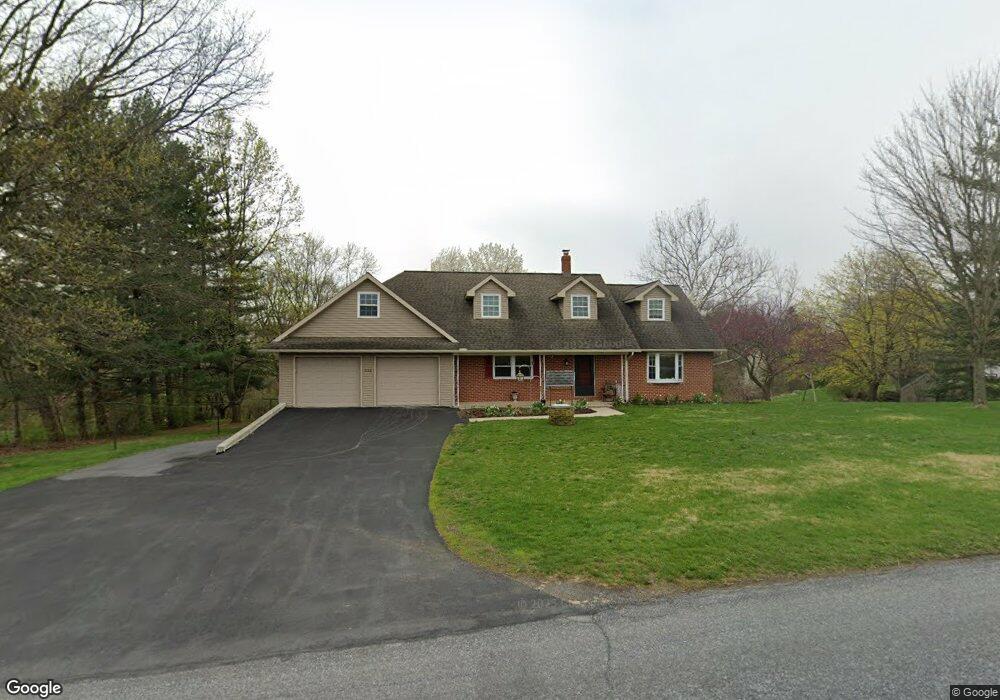
228 Skyview Ln Lititz, PA 17543
Estimated Value: $449,038 - $567,000
3
Beds
3
Baths
1,686
Sq Ft
$307/Sq Ft
Est. Value
About This Home
This home is located at 228 Skyview Ln, Lititz, PA 17543 and is currently estimated at $516,760, approximately $306 per square foot. 228 Skyview Ln is a home located in Lancaster County with nearby schools including Warwick Senior High School, Penn Johns Parochial School, and Linden Hall.
Ownership History
Date
Name
Owned For
Owner Type
Purchase Details
Closed on
Sep 3, 2025
Sold by
Rutt Marlin R and Rutt Jeanette H
Bought by
Rutt Marlin R and Rutt Jeanette H
Current Estimated Value
Purchase Details
Closed on
Dec 7, 2012
Sold by
Zwally Arliss J
Bought by
Rutt Marlin R
Home Financials for this Owner
Home Financials are based on the most recent Mortgage that was taken out on this home.
Original Mortgage
$155,200
Interest Rate
3.46%
Mortgage Type
New Conventional
Purchase Details
Closed on
Oct 2, 2012
Sold by
Zwally Arliss J and Zwally Eugene
Bought by
Zwally Arliss J
Create a Home Valuation Report for This Property
The Home Valuation Report is an in-depth analysis detailing your home's value as well as a comparison with similar homes in the area
Home Values in the Area
Average Home Value in this Area
Purchase History
| Date | Buyer | Sale Price | Title Company |
|---|---|---|---|
| Rutt Marlin R | -- | None Listed On Document | |
| Rutt Marlin R | $194,000 | None Available | |
| Zwally Arliss J | -- | None Available |
Source: Public Records
Mortgage History
| Date | Status | Borrower | Loan Amount |
|---|---|---|---|
| Previous Owner | Rutt Marlin R | $155,200 |
Source: Public Records
Tax History Compared to Growth
Tax History
| Year | Tax Paid | Tax Assessment Tax Assessment Total Assessment is a certain percentage of the fair market value that is determined by local assessors to be the total taxable value of land and additions on the property. | Land | Improvement |
|---|---|---|---|---|
| 2025 | $4,846 | $247,200 | $89,500 | $157,700 |
| 2024 | $4,846 | $247,200 | $89,500 | $157,700 |
| 2023 | $4,824 | $247,200 | $89,500 | $157,700 |
| 2022 | $4,824 | $247,200 | $89,500 | $157,700 |
| 2021 | $4,824 | $247,200 | $89,500 | $157,700 |
| 2020 | $4,824 | $247,200 | $89,500 | $157,700 |
| 2019 | $4,824 | $247,200 | $89,500 | $157,700 |
| 2018 | $4,047 | $247,200 | $89,500 | $157,700 |
| 2017 | $5,132 | $207,300 | $63,700 | $143,600 |
| 2016 | $5,132 | $207,300 | $63,700 | $143,600 |
| 2015 | $831 | $207,300 | $63,700 | $143,600 |
| 2014 | $4,086 | $158,400 | $63,700 | $94,700 |
Source: Public Records
Map
Nearby Homes