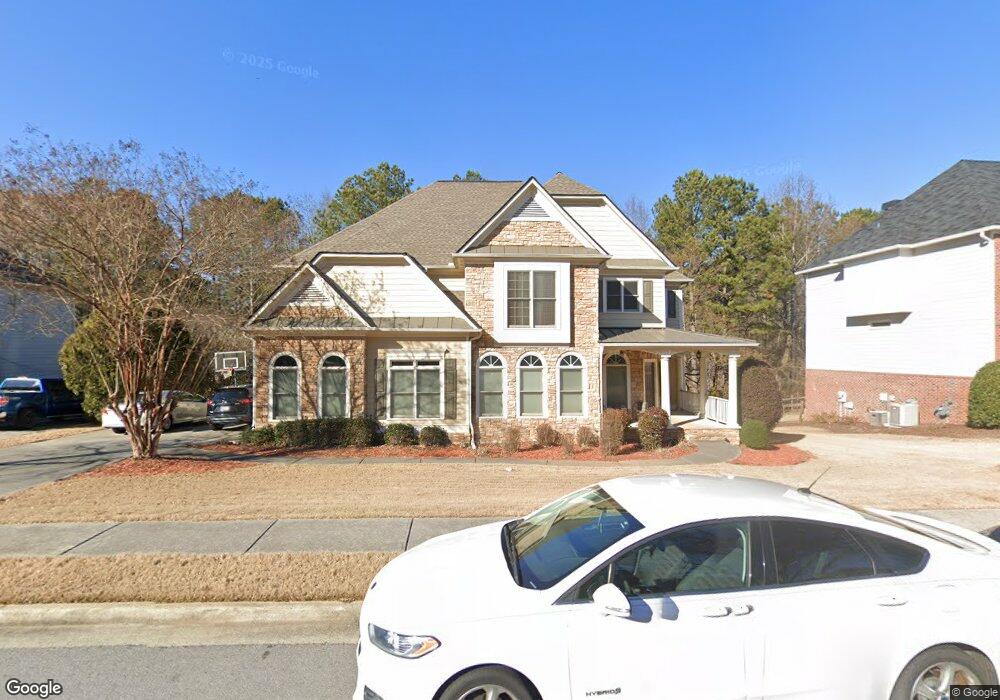
228 Thorncliff Landing Acworth, GA 30101
Cedarcrest NeighborhoodEstimated Value: $625,484 - $758,000
3
Beds
4
Baths
3,258
Sq Ft
$209/Sq Ft
Est. Value
About This Home
This home is located at 228 Thorncliff Landing, Acworth, GA 30101 and is currently estimated at $680,371, approximately $208 per square foot. 228 Thorncliff Landing is a home located in Paulding County with nearby schools including Floyd L. Shelton Elementary School at Crossroad, Sammy Mcclure Sr. Middle School, and North Paulding High School.
Ownership History
Date
Name
Owned For
Owner Type
Purchase Details
Closed on
Jul 6, 2016
Sold by
Rakestraw Properties 1 Lp
Bought by
Morgan Sharon Rakestraw
Current Estimated Value
Purchase Details
Closed on
Dec 12, 2005
Sold by
Sharp Residential Llc
Bought by
Johnson Andrew and Johnson Anisa N
Home Financials for this Owner
Home Financials are based on the most recent Mortgage that was taken out on this home.
Original Mortgage
$140,000
Interest Rate
6.28%
Mortgage Type
New Conventional
Purchase Details
Closed on
Jun 29, 2005
Sold by
Temco Associates Llc
Bought by
Sharp Residential Llc
Home Financials for this Owner
Home Financials are based on the most recent Mortgage that was taken out on this home.
Original Mortgage
$468,334
Interest Rate
5.46%
Create a Home Valuation Report for This Property
The Home Valuation Report is an in-depth analysis detailing your home's value as well as a comparison with similar homes in the area
Home Values in the Area
Average Home Value in this Area
Purchase History
| Date | Buyer | Sale Price | Title Company |
|---|---|---|---|
| Morgan Sharon Rakestraw | -- | -- | |
| Johnson Andrew | $401,300 | -- | |
| Sharp Residential Llc | $487,900 | -- |
Source: Public Records
Mortgage History
| Date | Status | Borrower | Loan Amount |
|---|---|---|---|
| Previous Owner | Johnson Andrew | $140,000 | |
| Previous Owner | Sharp Residential Llc | $468,334 |
Source: Public Records
Tax History Compared to Growth
Tax History
| Year | Tax Paid | Tax Assessment Tax Assessment Total Assessment is a certain percentage of the fair market value that is determined by local assessors to be the total taxable value of land and additions on the property. | Land | Improvement |
|---|---|---|---|---|
| 2024 | $6,319 | $257,280 | $31,200 | $226,080 |
| 2023 | $5,902 | $228,912 | $31,200 | $197,712 |
| 2022 | $5,632 | $217,896 | $31,200 | $186,696 |
| 2021 | $4,914 | $170,972 | $31,200 | $139,772 |
| 2020 | $4,563 | $155,480 | $31,200 | $124,280 |
| 2019 | $4,280 | $143,920 | $31,200 | $112,720 |
| 2018 | $4,764 | $160,000 | $31,200 | $128,800 |
| 2017 | $4,556 | $151,000 | $38,400 | $112,600 |
| 2016 | $4,113 | $137,880 | $32,000 | $105,880 |
| 2015 | $3,847 | $126,840 | $32,000 | $94,840 |
| 2014 | $4,339 | $139,320 | $32,000 | $107,320 |
| 2013 | -- | $119,800 | $32,000 | $87,800 |
Source: Public Records
Map
Nearby Homes
- 37 Bluestone Ct
- 261 Highcrest Dr
- 331 Brisbane Dr
- 216 Brisbane Dr
- 254 Broadstone Blvd
- 138 Highcrest Dr
- 51 Sagemont Ct
- 986 Carl Sanders Dr
- 123 Candler Loop
- 28 Vandiver Ct
- 64 Telfair Ct
- 954 Carl Sanders Dr
- 1022 Carl Sanders Dr
- 300 Carl Sanders Dr
- 681 Carl Sanders Dr
- 583 Carl Sanders Dr
- 71 Vandiver Ct
- 109 Applewood Ln
- 39 Telfair Ct
- 84 Cedarcrest Village Ln
- 206 Thorncliff Landing
- 242 Thorncliff Landing
- 0 Thorncliff Landing Unit 8878713
- 0 Thorncliff Landing Unit 8844240
- 0 Thorncliff Landing Unit 8818911
- 0 Thorncliff Landing Unit 8796827
- 0 Thorncliff Landing Unit 8718896
- 0 Thorncliff Landing Unit 8633753
- 0 Thorncliff Landing Unit 7333339
- 0 Thorncliff Landing Unit 7215749
- 0 Thorncliff Landing Unit 7074648
- 0 Thorncliff Landing
- 186 Thorncliff Landing
- 262 Thorncliff Landing
- 209 Thorncliff Landing
- 229 Thorncliff Landing
- 187 Thorncliff Landing
- 172 Thorncliff Landing Unit 5
- 278 Thorncliff Landing
- 275 Thorncliff Landing