Estimated Value: $952,000 - $1,186,107
3
Beds
4
Baths
2,410
Sq Ft
$445/Sq Ft
Est. Value
About This Home
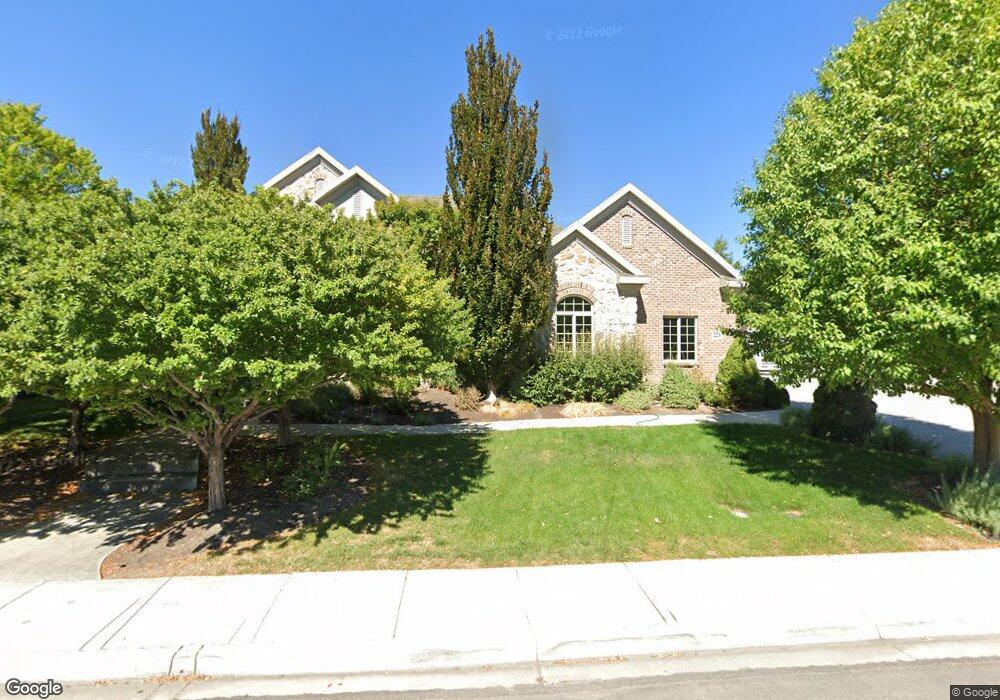
This home is located at 228 W 1850 N, Lehi, UT 84043 and is currently estimated at $1,071,777, approximately $444 per square foot. 228 W 1850 N is a home located in Utah County with nearby schools including Sego Lily Elementary School, Lehi Junior High School, and Skyridge High School.
Ownership History
Date
Name
Owned For
Owner Type
Purchase Details
Closed on
May 22, 2014
Sold by
Baum Christopher O and Baum Karri Ann
Bought by
Gardner Michael D and Gardner Judith L
Current Estimated Value
Home Financials for this Owner
Home Financials are based on the most recent Mortgage that was taken out on this home.
Original Mortgage
$248,000
Outstanding Balance
$188,864
Interest Rate
4.31%
Mortgage Type
New Conventional
Estimated Equity
$882,913
Purchase Details
Closed on
May 18, 2010
Sold by
Baum Larry Davis and Baum Suellen
Bought by
Baum Christopher O and Baum Karri Ann
Home Financials for this Owner
Home Financials are based on the most recent Mortgage that was taken out on this home.
Original Mortgage
$170,000
Interest Rate
5.21%
Mortgage Type
Seller Take Back
Purchase Details
Closed on
Jul 29, 2002
Sold by
Action Title Company Inc
Bought by
Baum Christopher O and Baum Karri Ann
Purchase Details
Closed on
May 22, 2000
Sold by
Gardner Michael D and Gardner Judith L
Bought by
Gardner Michael Dean and Gardner Judith Lorraine
Create a Home Valuation Report for This Property
The Home Valuation Report is an in-depth analysis detailing your home's value as well as a comparison with similar homes in the area
Home Values in the Area
Average Home Value in this Area
Purchase History
| Date | Buyer | Sale Price | Title Company |
|---|---|---|---|
| Gardner Michael D | -- | First American Title Co Llc | |
| Baum Christopher O | -- | Action Title Company | |
| Baum Christopher O | -- | Action Title Company | |
| Action Title Company Inc | -- | Action Title Company | |
| Gardner Michael Dean | -- | None Available |
Source: Public Records
Mortgage History
| Date | Status | Borrower | Loan Amount |
|---|---|---|---|
| Open | Gardner Michael D | $248,000 | |
| Previous Owner | Baum Christopher O | $170,000 |
Source: Public Records
Tax History Compared to Growth
Tax History
| Year | Tax Paid | Tax Assessment Tax Assessment Total Assessment is a certain percentage of the fair market value that is determined by local assessors to be the total taxable value of land and additions on the property. | Land | Improvement |
|---|---|---|---|---|
| 2025 | $4,538 | $613,360 | $330,300 | $784,900 |
| 2024 | $4,538 | $531,080 | $0 | $0 |
| 2023 | $4,164 | $529,100 | $0 | $0 |
| 2022 | $3,897 | $479,985 | $0 | $0 |
| 2021 | $3,507 | $653,100 | $191,100 | $462,000 |
| 2020 | $3,307 | $608,700 | $176,900 | $431,800 |
| 2019 | $3,181 | $608,700 | $176,900 | $431,800 |
| 2018 | $3,120 | $564,500 | $141,500 | $423,000 |
| 2017 | $2,912 | $280,115 | $0 | $0 |
| 2016 | $2,851 | $254,375 | $0 | $0 |
| 2015 | $2,917 | $247,060 | $0 | $0 |
| 2014 | $2,670 | $224,840 | $0 | $0 |
Source: Public Records
Map
Nearby Homes
- 1755 N 250 W
- 497 W 2200 N
- 4333 N Baiken Ridge Dr Unit 1020
- 595 W 2200 N
- 497 W 2280 N
- 192 E 2200 N
- 1817 W Bad Rock Cir
- 1329 N 100 E Unit 21
- 2287 N 750 W
- 1295 N 190 E
- 902 W 1500 N
- 1011 W Mountain Way Unit 316
- 1150 N 200 W Unit 6
- 2539 N 300 E
- 1301 N 900 W Unit 12
- 1610 N 1125 W
- 996 N 200 W
- 155 W State St Unit TRLR 3
- 537 W Sandhill Dr
- 1094 W 1425 N
- 256 W 1850 N
- 196 W 1850 N
- 237 Hidden Creek Dr
- 237 W Hidden Creek Dr
- 162 W 1850 N
- 211 Hidden Creek Dr
- 211 W Hidden Creek Dr
- 227 Secret Way
- 1947 Hidden Creek Dr
- 266 W 1850 N
- 1947 N Hidden Creek Dr
- 227 W 1850 N
- 195 W 1850 N
- 147 Secret Way
- 147 Secret Way
- 179 W Hidden Creek Dr
- 1861 N Nuttall Dr
- 147 W 1850 N
- 255 W 1850 N
- 1907 Nuttall Dr