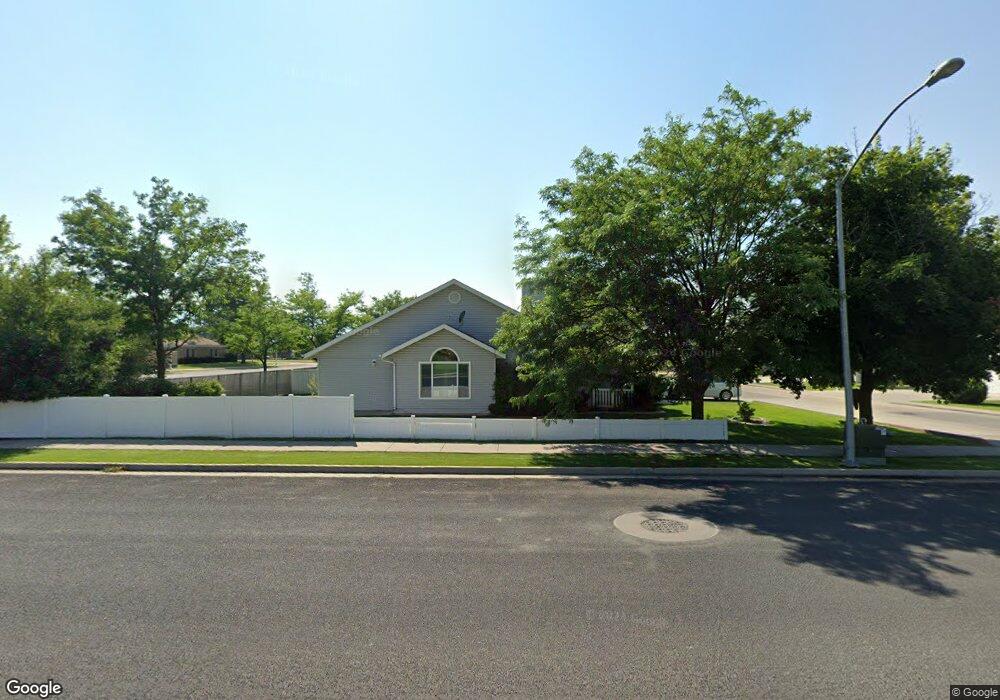
228 W 870 N Logan, UT 84321
Bridger NeighborhoodEstimated Value: $373,000 - $451,000
3
Beds
2
Baths
1,427
Sq Ft
$284/Sq Ft
Est. Value
About This Home
This home is located at 228 W 870 N, Logan, UT 84321 and is currently estimated at $405,773, approximately $284 per square foot. 228 W 870 N is a home located in Cache County with nearby schools including Bridger School, Mount Logan Middle School, and Logan High School.
Ownership History
Date
Name
Owned For
Owner Type
Purchase Details
Closed on
Mar 28, 2024
Sold by
Thompson Mark Allen and Thompson Mary Esther
Bought by
Leora H Wilson Family Inter Vivos Revocable T and Wilson
Current Estimated Value
Purchase Details
Closed on
Jan 4, 2023
Sold by
Hoskisson Kenneth
Bought by
Thompson Mark Allen and Thompson Mary Esther
Home Financials for this Owner
Home Financials are based on the most recent Mortgage that was taken out on this home.
Original Mortgage
$310,500
Interest Rate
6.58%
Mortgage Type
New Conventional
Create a Home Valuation Report for This Property
The Home Valuation Report is an in-depth analysis detailing your home's value as well as a comparison with similar homes in the area
Home Values in the Area
Average Home Value in this Area
Purchase History
| Date | Buyer | Sale Price | Title Company |
|---|---|---|---|
| Leora H Wilson Family Inter Vivos Revocable T | -- | None Listed On Document | |
| Thompson Mark Allen | -- | Pinnacle Title | |
| Hoskisson Mark David | -- | Pinnacle Title |
Source: Public Records
Mortgage History
| Date | Status | Borrower | Loan Amount |
|---|---|---|---|
| Previous Owner | Thompson Mark Allen | $310,500 |
Source: Public Records
Tax History Compared to Growth
Tax History
| Year | Tax Paid | Tax Assessment Tax Assessment Total Assessment is a certain percentage of the fair market value that is determined by local assessors to be the total taxable value of land and additions on the property. | Land | Improvement |
|---|---|---|---|---|
| 2025 | $1,495 | $193,325 | $0 | $0 |
| 2024 | $1,548 | $193,940 | $0 | $0 |
| 2023 | $1,530 | $182,745 | $0 | $0 |
| 2022 | $1,639 | $182,745 | $0 | $0 |
| 2021 | $1,415 | $243,810 | $42,000 | $201,810 |
| 2020 | $1,205 | $186,843 | $42,000 | $144,843 |
| 2019 | $1,260 | $186,842 | $42,000 | $144,842 |
| 2018 | $1,240 | $167,950 | $42,000 | $125,950 |
| 2017 | $1,202 | $86,075 | $0 | $0 |
| 2016 | $1,246 | $80,575 | $0 | $0 |
| 2015 | $1,185 | $81,730 | $0 | $0 |
| 2014 | $1,071 | $81,730 | $0 | $0 |
| 2013 | -- | $81,730 | $0 | $0 |
Source: Public Records
Map
Nearby Homes