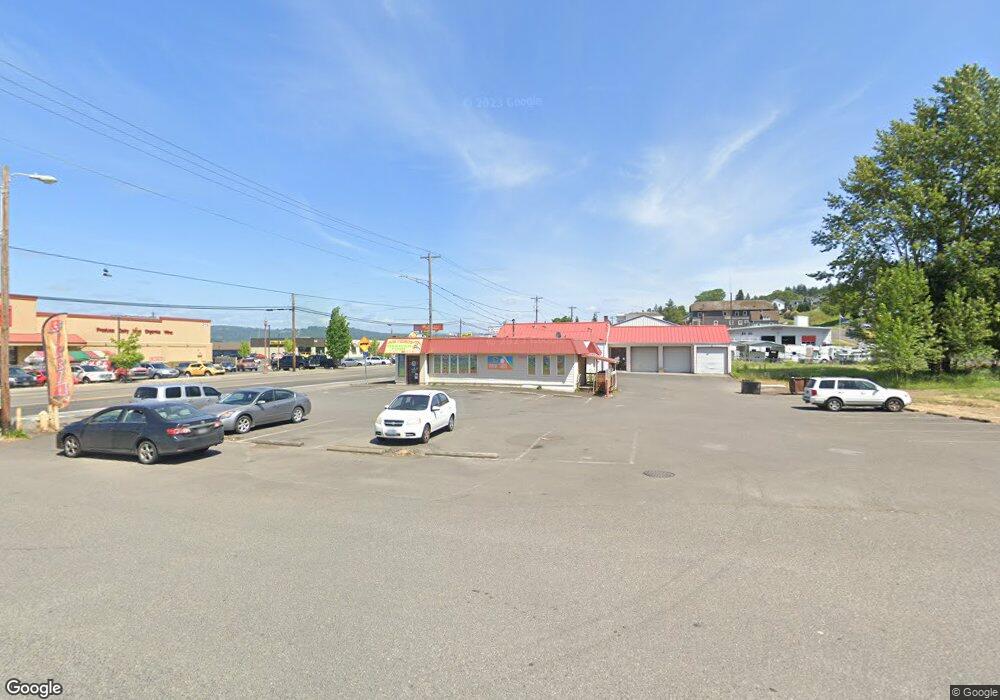
228 W B St Rainier, OR 97048
Estimated Value: $489,015
Studio
--
Bath
2,000
Sq Ft
$245/Sq Ft
Est. Value
About This Home
This home is located at 228 W B St, Rainier, OR 97048 and is currently estimated at $489,015, approximately $244 per square foot. 228 W B St is a home located in Columbia County with nearby schools including Hudson Park Elementary School, Rainier Junior/Senior High School, and North Columbia Academy.
Ownership History
Date
Name
Owned For
Owner Type
Purchase Details
Closed on
Dec 16, 2015
Sold by
Pelayo Garcia Hector
Bought by
Uribe Pelayo Hector and Uribe De Pelayo Maribel
Current Estimated Value
Purchase Details
Closed on
Oct 22, 2015
Sold by
Chan Wing Cheuk and Chan Feng Ling
Bought by
Garcia Hector Palayo
Purchase Details
Closed on
May 5, 2008
Sold by
Richmond William P and Richmond Caroline
Bought by
Chan Wing Cheuk and Chan Feng Ling
Home Financials for this Owner
Home Financials are based on the most recent Mortgage that was taken out on this home.
Original Mortgage
$247,500
Interest Rate
5.88%
Mortgage Type
Commercial
Purchase Details
Closed on
Apr 22, 2008
Sold by
Leever Irene E
Bought by
Richmond William P and Richmond Caroline
Home Financials for this Owner
Home Financials are based on the most recent Mortgage that was taken out on this home.
Original Mortgage
$247,500
Interest Rate
5.88%
Mortgage Type
Commercial
Create a Home Valuation Report for This Property
The Home Valuation Report is an in-depth analysis detailing your home's value as well as a comparison with similar homes in the area
Purchase History
| Date | Buyer | Sale Price | Title Company |
|---|---|---|---|
| Uribe Pelayo Hector | -- | None Available | |
| Garcia Hector Palayo | $260,000 | Ticor Title | |
| Chan Wing Cheuk | $400,000 | Ticor Title | |
| Richmond William P | -- | Ticor Title |
Source: Public Records
Mortgage History
| Date | Status | Borrower | Loan Amount |
|---|---|---|---|
| Previous Owner | Richmond William P | $247,500 |
Source: Public Records
Tax History
| Year | Tax Paid | Tax Assessment Tax Assessment Total Assessment is a certain percentage of the fair market value that is determined by local assessors to be the total taxable value of land and additions on the property. | Land | Improvement |
|---|---|---|---|---|
| 2025 | $3,463 | $187,500 | $148,960 | $38,540 |
| 2024 | $3,382 | $182,040 | $144,620 | $37,420 |
| 2023 | $3,335 | $176,740 | $140,410 | $36,330 |
| 2022 | $3,185 | $171,600 | $136,330 | $35,270 |
| 2021 | $3,133 | $166,610 | $139,530 | $27,080 |
| 2020 | $3,045 | $161,760 | $81,730 | $80,030 |
| 2019 | $2,997 | $157,050 | $81,410 | $75,640 |
| 2018 | $2,928 | $152,480 | $120,200 | $32,280 |
| 2017 | $2,888 | $148,040 | $116,700 | $31,340 |
| 2016 | $2,817 | $143,730 | $113,300 | $30,430 |
| 2015 | $2,719 | $139,550 | $110,010 | $29,540 |
| 2014 | $2,637 | $135,490 | $82,020 | $53,470 |
Source: Public Records
Map
Nearby Homes
Your Personal Tour Guide
Ask me questions while you tour the home.