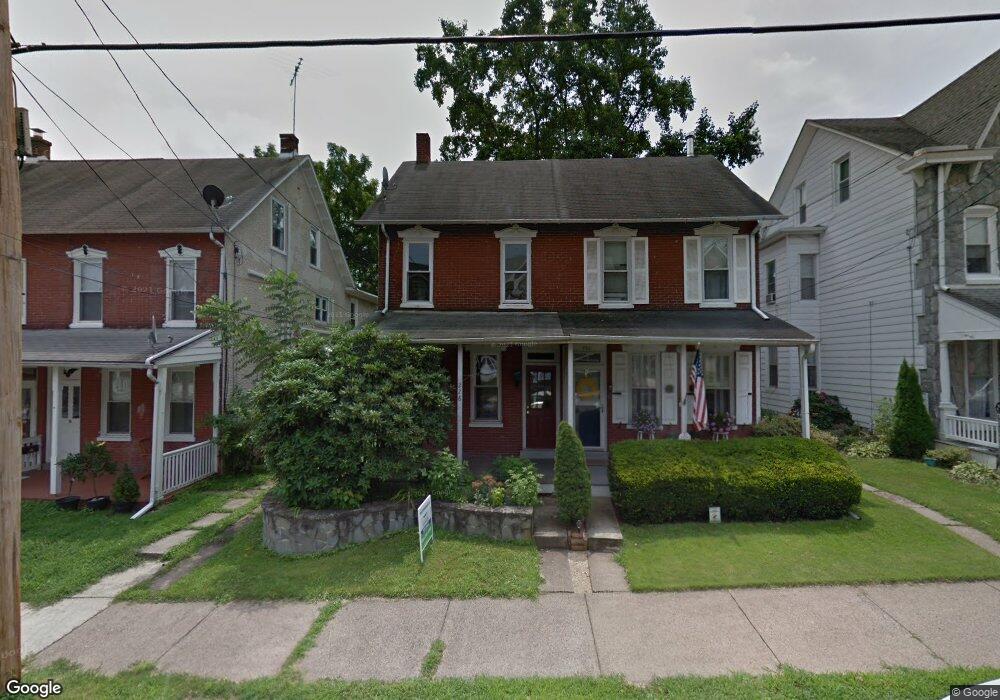
228 Yost Ave Unit 2ND FL Spring City, PA 19475
Estimated Value: $230,176 - $317,000
2
Beds
1
Bath
900
Sq Ft
$296/Sq Ft
Est. Value
About This Home
This home is located at 228 Yost Ave Unit 2ND FL, Spring City, PA 19475 and is currently estimated at $266,794, approximately $296 per square foot. 228 Yost Ave Unit 2ND FL is a home located in Chester County with nearby schools including Spring-Ford Middle School 8th Grade Center, Spring-Ford Middle School 5/6/7 Grade Center, and Spring-Ford Area High School.
Ownership History
Date
Name
Owned For
Owner Type
Purchase Details
Closed on
Sep 6, 2018
Sold by
Wilmington Savings Fund Society Fsb
Bought by
Niemeyer Michael R
Current Estimated Value
Purchase Details
Closed on
Nov 1, 2017
Sold by
Chester County Sheriff
Bought by
Normandy Mortgage Loan Trust
Purchase Details
Closed on
Oct 17, 2006
Sold by
Kidwell Jennifer R and Estate Of David S Kidwell
Bought by
Corteal Steve
Home Financials for this Owner
Home Financials are based on the most recent Mortgage that was taken out on this home.
Original Mortgage
$162,000
Interest Rate
9.73%
Mortgage Type
Purchase Money Mortgage
Create a Home Valuation Report for This Property
The Home Valuation Report is an in-depth analysis detailing your home's value as well as a comparison with similar homes in the area
Home Values in the Area
Average Home Value in this Area
Purchase History
| Date | Buyer | Sale Price | Title Company |
|---|---|---|---|
| Niemeyer Michael R | $85,000 | Servicelink Llc | |
| Normandy Mortgage Loan Trust | $83,689 | -- | |
| Corteal Steve | $162,000 | None Available |
Source: Public Records
Mortgage History
| Date | Status | Borrower | Loan Amount |
|---|---|---|---|
| Previous Owner | Corteal Steve | $162,000 |
Source: Public Records
Tax History Compared to Growth
Tax History
| Year | Tax Paid | Tax Assessment Tax Assessment Total Assessment is a certain percentage of the fair market value that is determined by local assessors to be the total taxable value of land and additions on the property. | Land | Improvement |
|---|---|---|---|---|
| 2025 | $1,798 | $44,280 | $28,700 | $15,580 |
| 2024 | $1,798 | $44,280 | $28,700 | $15,580 |
| 2023 | $1,745 | $44,280 | $28,700 | $15,580 |
| 2022 | $1,703 | $44,280 | $28,700 | $15,580 |
| 2021 | $1,679 | $44,280 | $28,700 | $15,580 |
| 2020 | $1,627 | $44,280 | $28,700 | $15,580 |
| 2019 | $1,592 | $44,280 | $28,700 | $15,580 |
| 2018 | $1,549 | $44,280 | $28,700 | $15,580 |
| 2017 | $1,549 | $44,280 | $28,700 | $15,580 |
| 2016 | $176 | $44,280 | $28,700 | $15,580 |
| 2015 | $176 | $44,280 | $28,700 | $15,580 |
| 2014 | $176 | $44,280 | $28,700 | $15,580 |
Source: Public Records
Map
Nearby Homes