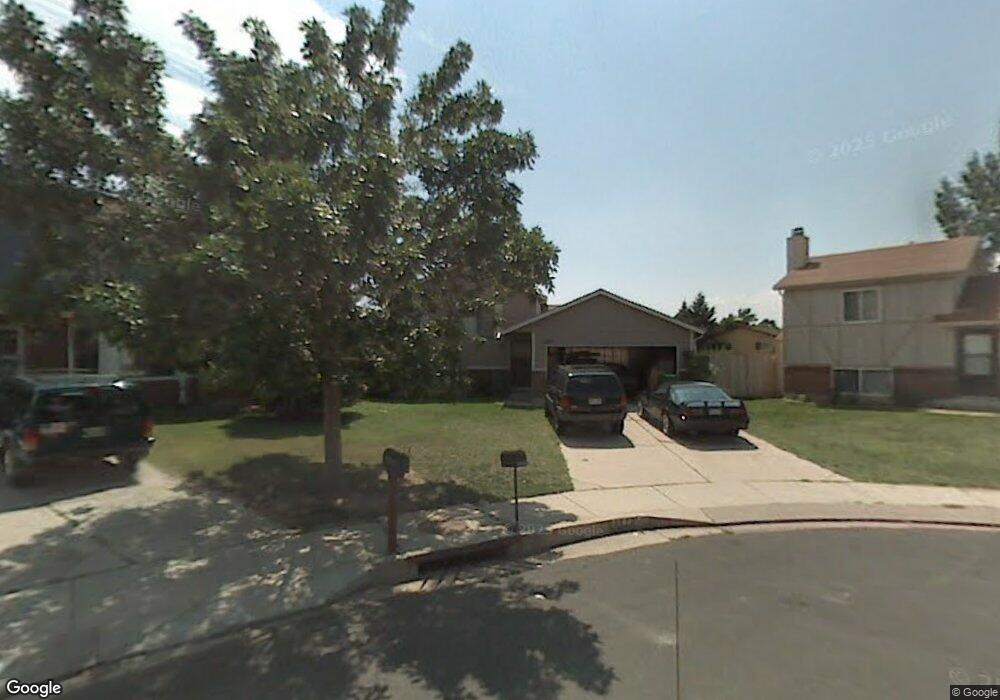
2280 Anthony Ct Colorado Springs, CO 80916
Gateway Park NeighborhoodEstimated Value: $335,000 - $362,000
3
Beds
2
Baths
682
Sq Ft
$517/Sq Ft
Est. Value
About This Home
This home is located at 2280 Anthony Ct, Colorado Springs, CO 80916 and is currently estimated at $352,416, approximately $516 per square foot. 2280 Anthony Ct is a home located in El Paso County with nearby schools including Bricker Elementary School, Panorama Middle School, and Sierra High School.
Ownership History
Date
Name
Owned For
Owner Type
Purchase Details
Closed on
May 20, 2021
Sold by
Christian Terrance K and Bustick Rebecca H
Bought by
Hurst Dakota
Current Estimated Value
Home Financials for this Owner
Home Financials are based on the most recent Mortgage that was taken out on this home.
Original Mortgage
$315,000
Outstanding Balance
$285,469
Interest Rate
3.1%
Mortgage Type
New Conventional
Estimated Equity
$66,947
Purchase Details
Closed on
Jun 19, 2013
Sold by
Christian Terrance R
Bought by
Christian Terrance R and Busick Rebecca H
Purchase Details
Closed on
Nov 27, 2009
Sold by
Haggar Robert E and Haggar Chong S
Bought by
Christian Terrance R
Home Financials for this Owner
Home Financials are based on the most recent Mortgage that was taken out on this home.
Original Mortgage
$127,687
Interest Rate
5.01%
Mortgage Type
VA
Purchase Details
Closed on
Aug 28, 2002
Sold by
Cearley John D and Cearley Martha
Bought by
Cehrley John W and Cehrley Lois M
Purchase Details
Closed on
Jun 1, 1987
Bought by
Busick Rebecca H
Purchase Details
Closed on
May 1, 1983
Bought by
Busick Rebecca H
Create a Home Valuation Report for This Property
The Home Valuation Report is an in-depth analysis detailing your home's value as well as a comparison with similar homes in the area
Home Values in the Area
Average Home Value in this Area
Purchase History
| Date | Buyer | Sale Price | Title Company |
|---|---|---|---|
| Hurst Dakota | $315,000 | Fidelity National Title | |
| Christian Terrance R | -- | None Available | |
| Christian Terrance R | $125,000 | -- | |
| Cehrley John W | -- | -- | |
| Busick Rebecca H | -- | -- | |
| Busick Rebecca H | -- | -- |
Source: Public Records
Mortgage History
| Date | Status | Borrower | Loan Amount |
|---|---|---|---|
| Open | Hurst Dakota | $315,000 | |
| Previous Owner | Christian Terrance R | $127,687 |
Source: Public Records
Tax History Compared to Growth
Tax History
| Year | Tax Paid | Tax Assessment Tax Assessment Total Assessment is a certain percentage of the fair market value that is determined by local assessors to be the total taxable value of land and additions on the property. | Land | Improvement |
|---|---|---|---|---|
| 2025 | $1,143 | $22,820 | -- | -- |
| 2024 | $882 | $23,490 | $3,580 | $19,910 |
| 2023 | $882 | $23,490 | $3,580 | $19,910 |
| 2022 | $935 | $17,340 | $3,130 | $14,210 |
| 2021 | $999 | $17,840 | $3,220 | $14,620 |
| 2020 | $817 | $12,540 | $2,500 | $10,040 |
| 2019 | $792 | $12,540 | $2,500 | $10,040 |
| 2018 | $667 | $10,160 | $1,800 | $8,360 |
| 2017 | $509 | $10,160 | $1,800 | $8,360 |
| 2016 | $535 | $10,030 | $1,830 | $8,200 |
| 2015 | $535 | $10,030 | $1,830 | $8,200 |
| 2014 | $516 | $9,560 | $1,830 | $7,730 |
Source: Public Records
Map
Nearby Homes
- 2467 Lexington Village Ln Unit G3
- 2455 Lexington Village Ln Unit 3
- 4952 Joseph Dr
- 4725 Wineskin Cir
- 4920 Wineskin Cir
- 4731 Astrozon Blvd
- 2025 Grosbear Ln
- 2625 Plymouth Dr
- 2650 Plymouth Dr
- 2535 Helton Ct
- 4527 Lamplighter Cir Unit 3
- 4585 Gatewood Dr
- 2655 Prescott Cir E
- 4509 Lamplighter Cir
- 4505 Lamplighter Cir Unit 6
- 2522 Astrozon Cir
- 2742 Dickens Dr
- 2321 Lexington Village Ln
- 1945 Harwood Cir
- 2470 Astrozon Cir
- 2285 Anthony Ct
- 2270 Anthony Ct
- 4886 Gatewood Dr
- 2275 Anthony Ct
- 2260 Anthony Ct
- 4878 Gatewood Dr
- 2265 Anthony Ct
- 2250 Anthony Ct
- 4870 Gatewood Dr
- 2255 Anthony Ct
- 2335 Bruno Cir
- 2345 Bruno Cir
- 2325 Bruno Cir
- 2240 Anthony Ct
- 4891 Gatewood Dr
- 2355 Bruno Cir
- 2245 Anthony Ct
- 4862 Gatewood Dr
- 4883 Gatewood Dr
- 2365 Bruno Cir