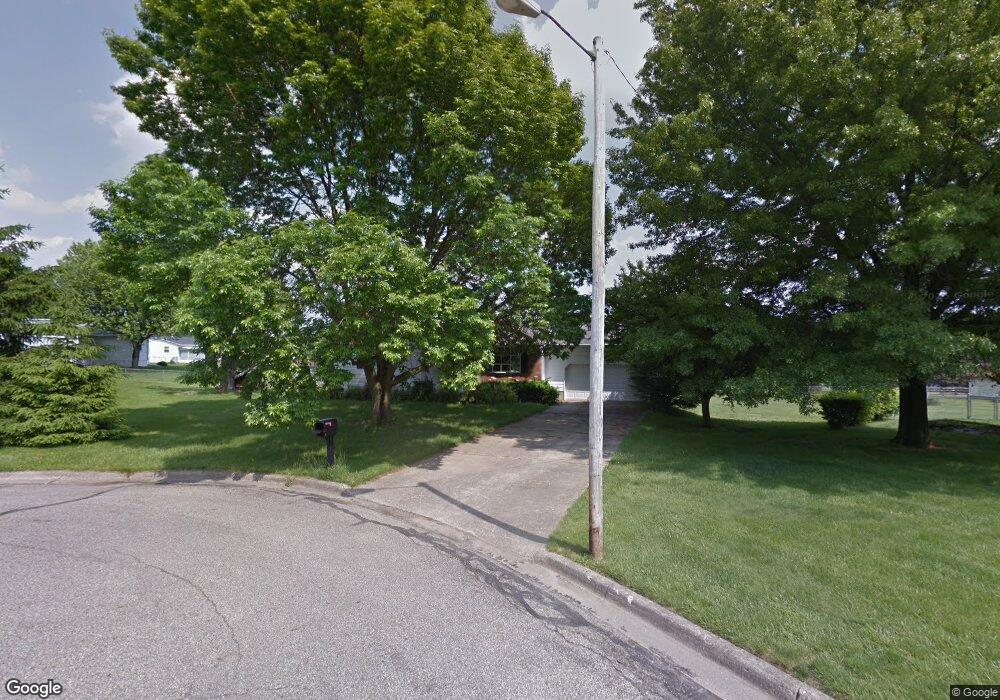
2280 Hawk St Lancaster, OH 43130
Estimated Value: $259,453 - $293,000
3
Beds
2
Baths
1,186
Sq Ft
$235/Sq Ft
Est. Value
About This Home
This home is located at 2280 Hawk St, Lancaster, OH 43130 and is currently estimated at $278,863, approximately $235 per square foot. 2280 Hawk St is a home located in Fairfield County with nearby schools including Medill Elementary School, Thomas Ewing Junior High School, and Lancaster High School.
Ownership History
Date
Name
Owned For
Owner Type
Purchase Details
Closed on
Apr 20, 2017
Sold by
Phayer Jodie A and Phayer Mark R
Bought by
Leslie Kevin W and Leslie Merrill J
Current Estimated Value
Home Financials for this Owner
Home Financials are based on the most recent Mortgage that was taken out on this home.
Original Mortgage
$120,000
Interest Rate
4.3%
Mortgage Type
Commercial
Purchase Details
Closed on
Dec 21, 2004
Sold by
Urling Jodie A and Phayer Jodie A
Bought by
Phayer Mark R and Phayer Jodie A
Home Financials for this Owner
Home Financials are based on the most recent Mortgage that was taken out on this home.
Original Mortgage
$119,200
Interest Rate
5.82%
Mortgage Type
New Conventional
Purchase Details
Closed on
Jul 29, 1992
Sold by
Urling John M
Bought by
Urling Jodie A
Create a Home Valuation Report for This Property
The Home Valuation Report is an in-depth analysis detailing your home's value as well as a comparison with similar homes in the area
Home Values in the Area
Average Home Value in this Area
Purchase History
| Date | Buyer | Sale Price | Title Company |
|---|---|---|---|
| Leslie Kevin W | $117,000 | Walmer Land Title Agency Box | |
| Phayer Mark R | -- | Landsel Title | |
| Urling Jodie A | -- | -- |
Source: Public Records
Mortgage History
| Date | Status | Borrower | Loan Amount |
|---|---|---|---|
| Closed | Leslie Kevin W | $120,000 | |
| Closed | Phayer Mark R | $119,200 | |
| Closed | Phayer Mark R | $14,900 |
Source: Public Records
Tax History
| Year | Tax Paid | Tax Assessment Tax Assessment Total Assessment is a certain percentage of the fair market value that is determined by local assessors to be the total taxable value of land and additions on the property. | Land | Improvement |
|---|---|---|---|---|
| 2025 | $4,979 | $92,510 | $22,180 | $70,330 |
| 2024 | $4,979 | $55,380 | $15,950 | $39,430 |
| 2023 | $1,910 | $52,500 | $15,950 | $36,550 |
| 2022 | $1,917 | $52,500 | $15,950 | $36,550 |
| 2021 | $1,657 | $42,510 | $13,910 | $28,600 |
| 2020 | $682 | $42,510 | $13,910 | $28,600 |
| 2019 | $1,510 | $42,510 | $13,910 | $28,600 |
| 2018 | $763 | $39,130 | $13,910 | $25,220 |
| 2017 | $1,222 | $32,680 | $11,660 | $21,020 |
| 2016 | $1,190 | $32,680 | $11,660 | $21,020 |
| 2015 | $1,190 | $31,720 | $11,660 | $20,060 |
| 2014 | $1,134 | $31,720 | $11,660 | $20,060 |
| 2013 | $1,134 | $31,720 | $11,660 | $20,060 |
Source: Public Records
Map
Nearby Homes
- 0 Old Millersport Rd NE Unit 225010386
- 2370 Scenic Dr NE
- 1826 Pleasantview Dr NE
- 2065 N Glenn Dr NE
- 0 Lucille Dr NE
- 1101 Beechwood Dr NE
- 1908 Branch Place
- 1916 Country Place
- 0 Tschopp Rd NE Unit Lot 17 225027320
- 0 Tschopp Rd NE Unit Lot 33 225027324
- 1189 Ridge Rd NE
- 0 Tiki Ln
- 1804 Pleasantville Rd
- 245 Rainbow Dr NE
- 0 Stringtown Rd NW
- 1434 Pleasantville Rd
- 2991 Coonpath Rd NE
- 1306 Shumaker Ave
- 1286 Stonehill Ln
- 1275 Stonington Ct Unit 1275
- 2278 Hawk St
- 1410 Ludwig Ct
- 1420 Ludwig Ct
- 1550 Rainbow Dr NE
- 1530 Rainbow Dr NE
- 1430 Ludwig Ct
- 2289 Hawk St
- 1600 Rainbow Dr NE
- 1520 Rainbow Dr NE
- 1440 Ludwig Ct
- 2293 Hawk St
- 1411 Ludwig Ct
- 1421 Ludwig Ct
- 2305 Hawk St
- 1559 Rainbow Dr NE
- 1431 Ludwig Ct
- 1529 Rainbow Dr NE
- 2241 Sheridan Dr
- 1583 Rainbow Dr NE
- 2316 Hawk St
Your Personal Tour Guide
Ask me questions while you tour the home.