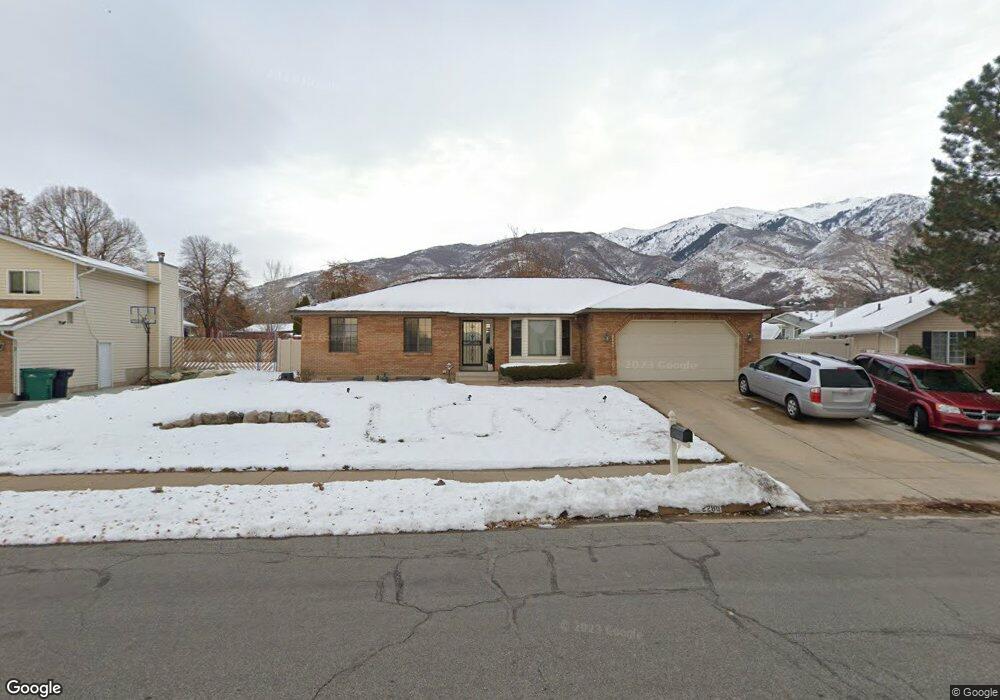
2280 N 2300 E Layton, UT 84040
Estimated Value: $531,000 - $624,632
6
Beds
3
Baths
3,510
Sq Ft
$167/Sq Ft
Est. Value
About This Home
This home is located at 2280 N 2300 E, Layton, UT 84040 and is currently estimated at $584,658, approximately $166 per square foot. 2280 N 2300 E is a home located in Davis County with nearby schools including Sarah Jane Adams Elementary School, North Layton Junior High School, and Northridge High School.
Ownership History
Date
Name
Owned For
Owner Type
Purchase Details
Closed on
Feb 13, 2021
Sold by
Austin Andrew V and Austin Susan D
Bought by
Austin Andrew V and Austin Susan D
Current Estimated Value
Purchase Details
Closed on
Nov 14, 2007
Sold by
Speechly Melanie and Brimley Melanie
Bought by
Austin Andrew and Austin Susan D
Home Financials for this Owner
Home Financials are based on the most recent Mortgage that was taken out on this home.
Original Mortgage
$200,000
Outstanding Balance
$125,770
Interest Rate
6.35%
Mortgage Type
Purchase Money Mortgage
Estimated Equity
$458,888
Purchase Details
Closed on
Apr 10, 2001
Sold by
Hodges Susan Jeanine Dee and Dee Patricia W
Bought by
Brimley Melanie
Purchase Details
Closed on
May 26, 1998
Sold by
Hodges Susan Jeanine Dee
Bought by
Hodges Susan Jeanine Dee and Dee Patricia W
Create a Home Valuation Report for This Property
The Home Valuation Report is an in-depth analysis detailing your home's value as well as a comparison with similar homes in the area
Home Values in the Area
Average Home Value in this Area
Purchase History
| Date | Buyer | Sale Price | Title Company |
|---|---|---|---|
| Austin Andrew V | -- | None Available | |
| Austin Andrew | -- | Utah Commercial Title Co | |
| Brimley Melanie | -- | Heritage West Title Insuranc | |
| Hodges Susan Jeanine Dee | -- | Backman Stewart Title Servic |
Source: Public Records
Mortgage History
| Date | Status | Borrower | Loan Amount |
|---|---|---|---|
| Open | Austin Andrew | $200,000 |
Source: Public Records
Tax History
| Year | Tax Paid | Tax Assessment Tax Assessment Total Assessment is a certain percentage of the fair market value that is determined by local assessors to be the total taxable value of land and additions on the property. | Land | Improvement |
|---|---|---|---|---|
| 2025 | $3,148 | $304,150 | $157,984 | $146,166 |
| 2024 | $2,986 | $292,600 | $174,992 | $117,608 |
| 2023 | $3,021 | $528,000 | $222,964 | $305,036 |
| 2022 | $3,132 | $299,200 | $120,712 | $178,488 |
| 2021 | $2,789 | $396,000 | $185,511 | $210,489 |
| 2020 | $2,553 | $347,000 | $157,559 | $189,441 |
| 2019 | $2,501 | $335,000 | $139,133 | $195,867 |
| 2018 | $2,284 | $307,000 | $114,235 | $192,765 |
| 2016 | $2,054 | $144,705 | $58,869 | $85,836 |
| 2015 | $1,991 | $133,925 | $58,869 | $75,056 |
| 2014 | $1,964 | $135,994 | $58,869 | $77,125 |
| 2013 | -- | $121,971 | $30,082 | $91,889 |
Source: Public Records
Map
Nearby Homes
- 2340 N 2050 E
- 2273 N 1975 E
- 2563 E 2250 N
- 2597 N 2300 E
- 1907 N Bridge Ct
- 2509 E 1900 N
- 2547 E 1900 N
- 1954 N 2600 E
- 2189 N 1950 E
- 2136 N 2800 E
- 2391 Kays Creek Dr
- 2353 Canyon View Dr
- 3142 E Thorley Dr
- 3138 E Thorley Dr
- 2569 N 2900 E
- 1935 Deere Valley Dr
- 1843 Hayes Dr
- 1911 Deere Valley Dr
- 1785 E 2825 N
- 1731 E 2825 N
Your Personal Tour Guide
Ask me questions while you tour the home.