Estimated Value: $952,557 - $1,478,000
4
Beds
5
Baths
4,939
Sq Ft
$227/Sq Ft
Est. Value
About This Home
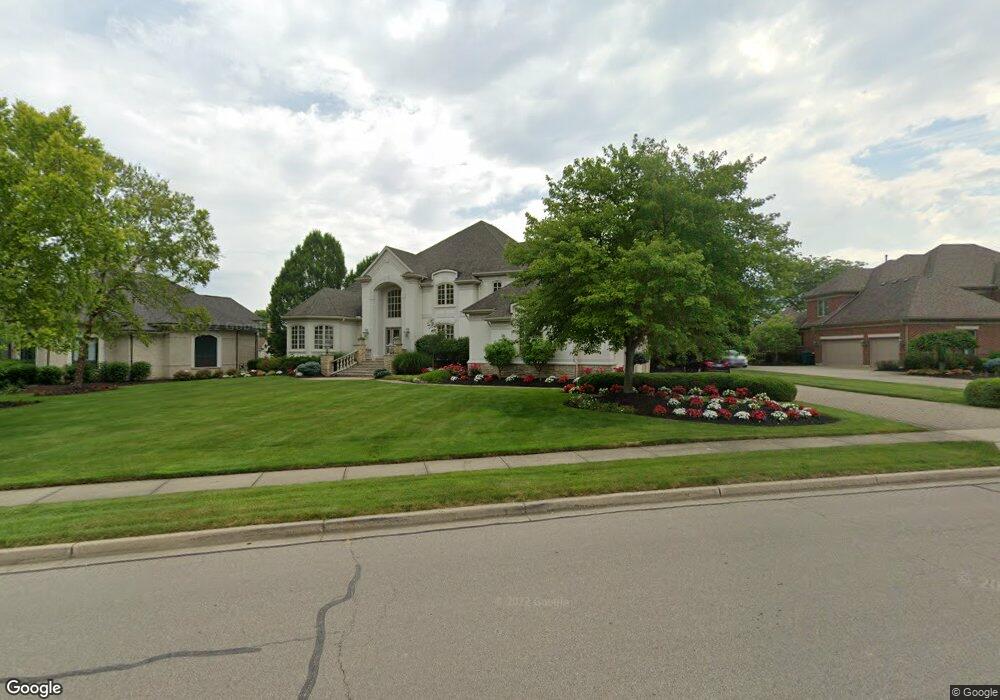
This home is located at 2280 Signature Dr N, Xenia, OH 45385 and is currently estimated at $1,122,389, approximately $227 per square foot. 2280 Signature Dr N is a home located in Greene County with nearby schools including Trebein Elementary School, Jacob Coy Middle School, and Beavercreek High School.
Ownership History
Date
Name
Owned For
Owner Type
Purchase Details
Closed on
Jan 30, 2020
Sold by
Brunner Priscilla E
Bought by
Dotson Douglas C and Brunner Qualified Priseilla E
Current Estimated Value
Purchase Details
Closed on
Dec 31, 2019
Sold by
Dotson Douglas C and M A B Irrevocable Trust
Bought by
Brunner Priscilla E
Purchase Details
Closed on
Aug 2, 2002
Sold by
King Jeffrey C and Towell King Ruth Anne
Bought by
Dotson Douglas C
Home Financials for this Owner
Home Financials are based on the most recent Mortgage that was taken out on this home.
Original Mortgage
$508,000
Interest Rate
6.5%
Purchase Details
Closed on
Aug 2, 1995
Sold by
Arnold Enterprises Inc
Bought by
King Jeffrey C and King Anne Anne Towell
Home Financials for this Owner
Home Financials are based on the most recent Mortgage that was taken out on this home.
Original Mortgage
$596,000
Interest Rate
7.25%
Mortgage Type
New Conventional
Create a Home Valuation Report for This Property
The Home Valuation Report is an in-depth analysis detailing your home's value as well as a comparison with similar homes in the area
Home Values in the Area
Average Home Value in this Area
Purchase History
| Date | Buyer | Sale Price | Title Company |
|---|---|---|---|
| Dotson Douglas C | -- | None Available | |
| Brunner Priscilla E | -- | None Available | |
| Dotson Douglas C | -- | None Available | |
| Dotson Douglas C | $727,000 | -- | |
| King Jeffrey C | $745,000 | -- |
Source: Public Records
Mortgage History
| Date | Status | Borrower | Loan Amount |
|---|---|---|---|
| Previous Owner | Dotson Douglas C | $508,000 | |
| Previous Owner | King Jeffrey C | $596,000 |
Source: Public Records
Tax History Compared to Growth
Tax History
| Year | Tax Paid | Tax Assessment Tax Assessment Total Assessment is a certain percentage of the fair market value that is determined by local assessors to be the total taxable value of land and additions on the property. | Land | Improvement |
|---|---|---|---|---|
| 2024 | $18,205 | $316,980 | $31,480 | $285,500 |
| 2023 | $18,205 | $316,980 | $31,480 | $285,500 |
| 2022 | $18,015 | $275,030 | $31,480 | $243,550 |
| 2021 | $18,195 | $275,030 | $31,480 | $243,550 |
| 2020 | $18,022 | $275,030 | $31,480 | $243,550 |
| 2019 | $18,022 | $248,980 | $28,440 | $220,540 |
| 2018 | $15,757 | $248,980 | $28,440 | $220,540 |
| 2017 | $15,096 | $248,980 | $28,440 | $220,540 |
| 2016 | $14,945 | $238,610 | $28,440 | $210,170 |
| 2015 | $7,519 | $238,610 | $28,440 | $210,170 |
| 2014 | $7,344 | $238,610 | $28,440 | $210,170 |
Source: Public Records
Map
Nearby Homes
- 90 Pawleys Plantation Ct
- 2284 Annandale Place
- 185 Barrington Village Dr
- 29 Governors Club Dr
- 2176 Meridian Ct
- 33 Governors Club Dr
- 463 Valhalla Ct
- 295 Stratford Ln
- 153 George Wythe Way
- 2580 Paydon Randoff Rd
- 79.4 acres Valley Springs Rd
- 131 Ridgebrook Trail
- 331 N Valley Rd
- 705 Memorial Dr
- Cheswicke Plan at Sky Crossing
- Barrett Plan at Sky Crossing
- Nicholas Plan at Sky Crossing
- Hampton Plan at Sky Crossing
- Serenity Plan at Sky Crossing
- Cooke Plan at Sky Crossing
- 2277 Melrose Dr
- 2277 Melrose Private Dr
- 2274 Signature Dr N
- 2281 Signature Dr N
- 2291 Signature Dr N
- 2259 Melrose Dr
- 2270 Signature Dr N
- 2301 Signature Dr N
- 2266 Signature Dr N
- 2262 Signature Dr N
- 2315 Signature Dr N
- 2300 Indian Ripple Rd
- 2256 Signature Dr N
- 2339 Sherwood Ct
- 2291 Annandale Place
- 2345 Sherwood Ct
- 2277 Annandale Place
- 2340 Indian Ripple Rd
- 2340 Indian Ripple Rd
- 117 Pawleys Plantation Ct