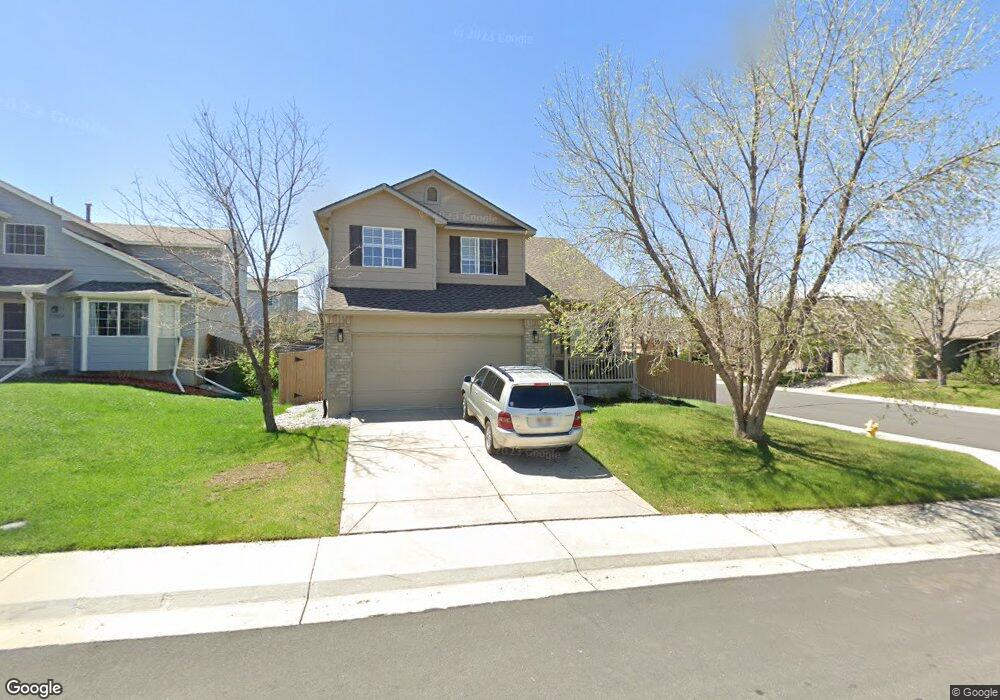
22802 E Belleview Ln Aurora, CO 80015
Saddle Rock Ridge NeighborhoodEstimated Value: $520,490 - $546,000
3
Beds
3
Baths
1,736
Sq Ft
$305/Sq Ft
Est. Value
About This Home
This home is located at 22802 E Belleview Ln, Aurora, CO 80015 and is currently estimated at $528,873, approximately $304 per square foot. 22802 E Belleview Ln is a home located in Arapahoe County with nearby schools including Antelope Ridge Elementary School, Thunder Ridge Middle School, and Eaglecrest High School.
Ownership History
Date
Name
Owned For
Owner Type
Purchase Details
Closed on
Jan 28, 2022
Sold by
Virote Maneepun
Bought by
Novak Ryan Alan and Witteborg Lauren Nicole
Current Estimated Value
Home Financials for this Owner
Home Financials are based on the most recent Mortgage that was taken out on this home.
Original Mortgage
$538,350
Outstanding Balance
$495,406
Interest Rate
3.45%
Mortgage Type
New Conventional
Estimated Equity
$33,467
Purchase Details
Closed on
Mar 2, 2015
Sold by
Maneepun Virote
Bought by
Maneepun Virote and Maneepun Kamoltorn
Purchase Details
Closed on
Jan 9, 2001
Sold by
Melody Homes Inc
Bought by
Maneepun Virote and Maneepun Suvadee
Home Financials for this Owner
Home Financials are based on the most recent Mortgage that was taken out on this home.
Original Mortgage
$130,900
Interest Rate
7.63%
Create a Home Valuation Report for This Property
The Home Valuation Report is an in-depth analysis detailing your home's value as well as a comparison with similar homes in the area
Home Values in the Area
Average Home Value in this Area
Purchase History
| Date | Buyer | Sale Price | Title Company |
|---|---|---|---|
| Novak Ryan Alan | $555,000 | Land Title Guarantee | |
| Maneepun Virote | -- | None Available | |
| Maneepun Virote | $200,236 | Land Title |
Source: Public Records
Mortgage History
| Date | Status | Borrower | Loan Amount |
|---|---|---|---|
| Open | Novak Ryan Alan | $538,350 | |
| Previous Owner | Maneepun Virote | $130,900 |
Source: Public Records
Tax History
| Year | Tax Paid | Tax Assessment Tax Assessment Total Assessment is a certain percentage of the fair market value that is determined by local assessors to be the total taxable value of land and additions on the property. | Land | Improvement |
|---|---|---|---|---|
| 2025 | $4,023 | $33,919 | -- | -- |
| 2024 | $3,613 | $35,240 | -- | -- |
| 2023 | $3,613 | $35,240 | $0 | $0 |
| 2022 | $3,011 | $26,675 | $0 | $0 |
| 2021 | $3,130 | $26,675 | $0 | $0 |
| 2020 | $3,128 | $27,678 | $0 | $0 |
| 2019 | $3,035 | $27,678 | $0 | $0 |
| 2018 | $2,763 | $22,867 | $0 | $0 |
| 2017 | $2,723 | $22,867 | $0 | $0 |
| 2016 | $1,533 | $20,067 | $0 | $0 |
| 2015 | $1,487 | $20,067 | $0 | $0 |
| 2014 | $1,158 | $16,580 | $0 | $0 |
| 2013 | -- | $17,360 | $0 | $0 |
Source: Public Records
Map
Nearby Homes
- 5090 S Wenatchee Cir
- 22894 E Progress Ave
- 22501 E Belleview Place
- 5060 S Ukraine St
- 22286 E Belleview Ln
- 5361 S Ukraine Way
- 5014 S Shawnee St
- 22153 E Belleview Ln
- 4830 S Versailles St
- 5450 S Valdai St
- 22822 E Union Cir
- 5453 S Sicily St
- 4877 S Algonquian Way
- 5435 S Shawnee Way
- 4927 S Addison Way
- 23372 E Chenango Place
- 5247 S Riviera Cir
- 5466 S Shawnee Way
- 5528 S Valdai St
- 23341 E Saratoga Cir
- 22804 E Belleview Ln
- 22803 E Progress Ave
- 22812 E Belleview Ln
- 22813 E Progress Ave
- 5157 S Versailles St
- 5147 S Versailles St
- 5177 S Versailles St
- 22801 E Belleview Ln
- 22803 E Belleview Ln
- 22822 E Belleview Ln
- 5137 S Versailles St
- 5187 S Versailles St
- 22811 E Belleview Ln
- 22823 E Progress Ave
- 5127 S Versailles St
- 22832 E Belleview Ln
- 0 S Versailles St
- 5197 S Versailles St
- 22821 E Belleview Ln
- 22833 E Progress Ave
Your Personal Tour Guide
Ask me questions while you tour the home.