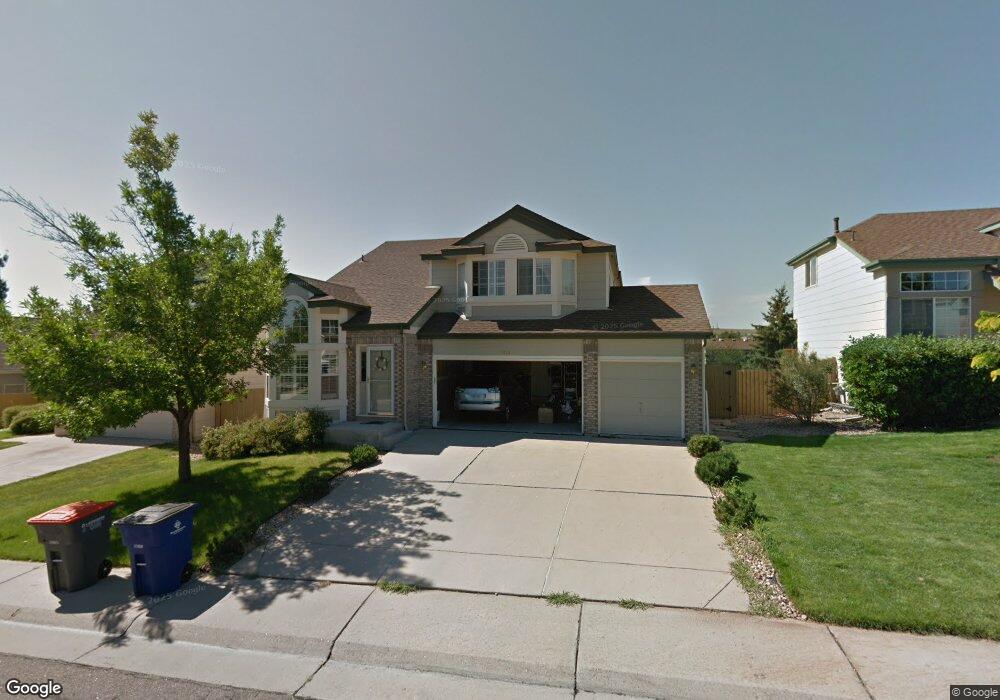
2281 Dailey St Superior, CO 80027
Estimated Value: $821,865 - $922,000
4
Beds
4
Baths
2,845
Sq Ft
$306/Sq Ft
Est. Value
About This Home
This home is located at 2281 Dailey St, Superior, CO 80027 and is currently estimated at $869,466, approximately $305 per square foot. 2281 Dailey St is a home located in Boulder County with nearby schools including Eldorado K-8 School, Superior Elementary School, and Monarch High School.
Ownership History
Date
Name
Owned For
Owner Type
Purchase Details
Closed on
Apr 15, 2002
Sold by
Goode Allen Richard S and Goode Allen Jeannine A
Bought by
Park Wounjhang
Current Estimated Value
Home Financials for this Owner
Home Financials are based on the most recent Mortgage that was taken out on this home.
Original Mortgage
$150,000
Interest Rate
6.8%
Purchase Details
Closed on
Dec 7, 2001
Sold by
Goode Allen Richard S and Goode Allen Jeannine A
Bought by
Goode Allen Richard S
Purchase Details
Closed on
Jun 17, 1997
Sold by
Richmond American Homes Of Colorado Inc
Bought by
Goode Allen Richard S
Home Financials for this Owner
Home Financials are based on the most recent Mortgage that was taken out on this home.
Original Mortgage
$119,290
Interest Rate
7.93%
Purchase Details
Closed on
Jul 28, 1993
Bought by
Park Wounjhang and Park Changim
Create a Home Valuation Report for This Property
The Home Valuation Report is an in-depth analysis detailing your home's value as well as a comparison with similar homes in the area
Home Values in the Area
Average Home Value in this Area
Purchase History
| Date | Buyer | Sale Price | Title Company |
|---|---|---|---|
| Park Wounjhang | $344,500 | -- | |
| Goode Allen Richard S | -- | -- | |
| Goode Allen Richard S | $219,290 | Land Title | |
| Park Wounjhang | -- | -- |
Source: Public Records
Mortgage History
| Date | Status | Borrower | Loan Amount |
|---|---|---|---|
| Closed | Park Wounjhang | $150,000 | |
| Previous Owner | Goode Allen Richard S | $119,290 |
Source: Public Records
Tax History
| Year | Tax Paid | Tax Assessment Tax Assessment Total Assessment is a certain percentage of the fair market value that is determined by local assessors to be the total taxable value of land and additions on the property. | Land | Improvement |
|---|---|---|---|---|
| 2025 | $5,643 | $54,469 | $20,844 | $33,625 |
| 2024 | $5,643 | $54,469 | $20,844 | $33,625 |
| 2023 | $5,565 | $54,458 | $18,392 | $39,751 |
| 2022 | $4,307 | $41,179 | $14,491 | $26,688 |
| 2021 | $4,600 | $45,552 | $16,030 | $29,522 |
| 2020 | $4,357 | $41,470 | $16,445 | $25,025 |
| 2019 | $4,297 | $41,470 | $16,445 | $25,025 |
| 2018 | $3,996 | $38,203 | $11,376 | $26,827 |
| 2017 | $4,084 | $42,236 | $12,577 | $29,659 |
| 2016 | $4,004 | $36,186 | $11,781 | $24,405 |
| 2015 | $3,806 | $32,795 | $13,134 | $19,661 |
| 2014 | $3,482 | $32,795 | $13,134 | $19,661 |
Source: Public Records
Map
Nearby Homes
- 2241 Dailey St
- 743 Eaton Cir
- 2225 Clayton Cir
- 390 Andrew Way
- 683 Eaton Cir
- 2280 Clayton Cir
- 2457 Ajax Ct
- 832 Eldorado Dr
- 882 Eldorado Dr
- 877 Eldorado Dr
- 977 Eldorado Dr
- 1009 Monarch Way
- 954 Lasalle St
- 2750 Calmante Cir
- 2713 Slate Ct
- 2790 Calmante Cir
- 1737 High Plains Ct
- 1697 High Plains Ct
- 246 Rockview Dr
- 1057 Rand Way
- 2291 Dailey St
- 2271 Dailey St
- 2261 Dailey St
- 2301 Dailey St
- 509 Briggs Place
- 519 Briggs Place
- 499 Briggs Place
- 2276 Dailey St
- 2251 Dailey St
- 2311 Dailey St
- 529 Briggs Place
- 2266 Dailey St
- 2286 Dailey St
- 489 Briggs Place
- 539 Briggs Place
- 2256 Dailey St
- 2296 Dailey St
- 479 Briggs Place
- 2306 Dailey St
- 549 Briggs Place
Your Personal Tour Guide
Ask me questions while you tour the home.