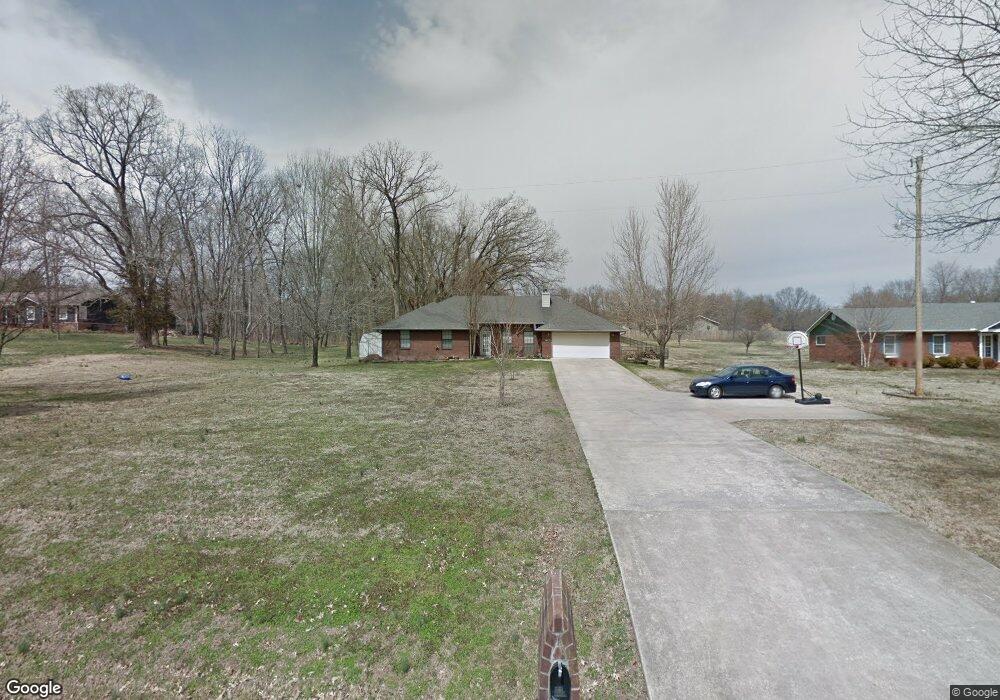
2281 Villa View Dr Siloam Springs, AR 72761
Estimated Value: $314,000 - $482,000
--
Bed
2
Baths
1,815
Sq Ft
$206/Sq Ft
Est. Value
About This Home
This home is located at 2281 Villa View Dr, Siloam Springs, AR 72761 and is currently estimated at $374,651, approximately $206 per square foot. 2281 Villa View Dr is a home located in Benton County with nearby schools including Northside Elementary School, Delbert Pete & Pat Allen Elementary School, and Southside Elementary School.
Ownership History
Date
Name
Owned For
Owner Type
Purchase Details
Closed on
Nov 16, 2006
Sold by
Bishop Eugene and Bishop Margaret Sue
Bought by
Beleche Jose and Beleche Socorro Padilla
Current Estimated Value
Purchase Details
Closed on
Dec 27, 2005
Sold by
Vale David T and Vale Judith A
Bought by
Beleche Jose and Beleche Socorro Padilla De
Home Financials for this Owner
Home Financials are based on the most recent Mortgage that was taken out on this home.
Original Mortgage
$140,000
Interest Rate
6.23%
Mortgage Type
New Conventional
Purchase Details
Closed on
Oct 9, 2003
Bought by
Vale
Purchase Details
Closed on
Feb 22, 1995
Bought by
Davis
Purchase Details
Closed on
Apr 18, 1994
Bought by
Bishop
Purchase Details
Closed on
Sep 22, 1988
Bought by
Dykes
Purchase Details
Closed on
Jan 19, 1987
Bought by
Azlin
Purchase Details
Closed on
Sep 7, 1984
Bought by
Mcilroy
Create a Home Valuation Report for This Property
The Home Valuation Report is an in-depth analysis detailing your home's value as well as a comparison with similar homes in the area
Home Values in the Area
Average Home Value in this Area
Purchase History
| Date | Buyer | Sale Price | Title Company |
|---|---|---|---|
| Beleche Jose | $50,000 | Rtc | |
| Beleche Jose | $175,000 | Waco Title Company | |
| Vale | $145,000 | -- | |
| Davis | $114,000 | -- | |
| Bishop | $16,000 | -- | |
| Dykes | $11,000 | -- | |
| Azlin | $27,000 | -- | |
| Mcilroy | -- | -- |
Source: Public Records
Mortgage History
| Date | Status | Borrower | Loan Amount |
|---|---|---|---|
| Previous Owner | Beleche Jose | $140,000 |
Source: Public Records
Tax History Compared to Growth
Tax History
| Year | Tax Paid | Tax Assessment Tax Assessment Total Assessment is a certain percentage of the fair market value that is determined by local assessors to be the total taxable value of land and additions on the property. | Land | Improvement |
|---|---|---|---|---|
| 2025 | $2,128 | $57,279 | $8,658 | $48,621 |
| 2024 | $2,085 | $57,279 | $8,658 | $48,621 |
| 2023 | $1,985 | $40,800 | $6,550 | $34,250 |
| 2022 | $1,522 | $40,800 | $6,550 | $34,250 |
| 2021 | $1,432 | $40,800 | $6,550 | $34,250 |
| 2020 | $1,351 | $29,970 | $6,550 | $23,420 |
| 2019 | $1,351 | $29,970 | $6,550 | $23,420 |
| 2018 | $1,376 | $29,970 | $6,550 | $23,420 |
| 2017 | $1,364 | $29,970 | $6,550 | $23,420 |
| 2016 | $1,364 | $29,970 | $6,550 | $23,420 |
| 2015 | $1,632 | $28,330 | $4,600 | $23,730 |
| 2014 | $1,282 | $28,330 | $4,600 | $23,730 |
Source: Public Records
Map
Nearby Homes
- 2670 Orchard Hill Rd
- 1909 Villa View Dr
- 1406 Avery Place
- 1707 N Dogwood St
- 1715 N Dogwood St
- 1609 N Dogwood St
- 1309 N Dogwood St
- 1617 N Dogwood St
- 1601 N Dogwood St
- 1541 N Dogwood St
- 1533 N Dogwood St
- 1108 Deerfield Meadow
- 2206 W University St
- 15120 S Highway 43
- 911 W Carley Dr
- 905 W Carley Dr
- 909 W Carley Dr
- 932 W Aiden Dr
- 14800 S Highway 43
- 14800 Arkansas 43
- 0 W Villa View Dr
- 2291 Villa View Dr
- 2210 Orchard Hill Rd
- 1860 Sycamore Heights Rd
- 2710 Orchard Hill Rd
- 1960 Sycamore Heights Rd
- 2405 Villa View Dr
- 23731 B Orchard Hill Rd
- 2610 Orchard Hill Rd
- 2290 Orchard Hill Rd
- 2360 Orchard Hill Rd
- 2291 Orchard Hill Rd
- 2560 Orchard Hill Rd
- 2725 Orchard Hill Rd
- 2501 Villa View Dr
- 2675 Orchard Hill Rd
- 2520 Orchard Hill Rd
- 2001 Villa View Dr
- 2609 Orchard Hill Rd
- 23827 Sycamore Heights Rd