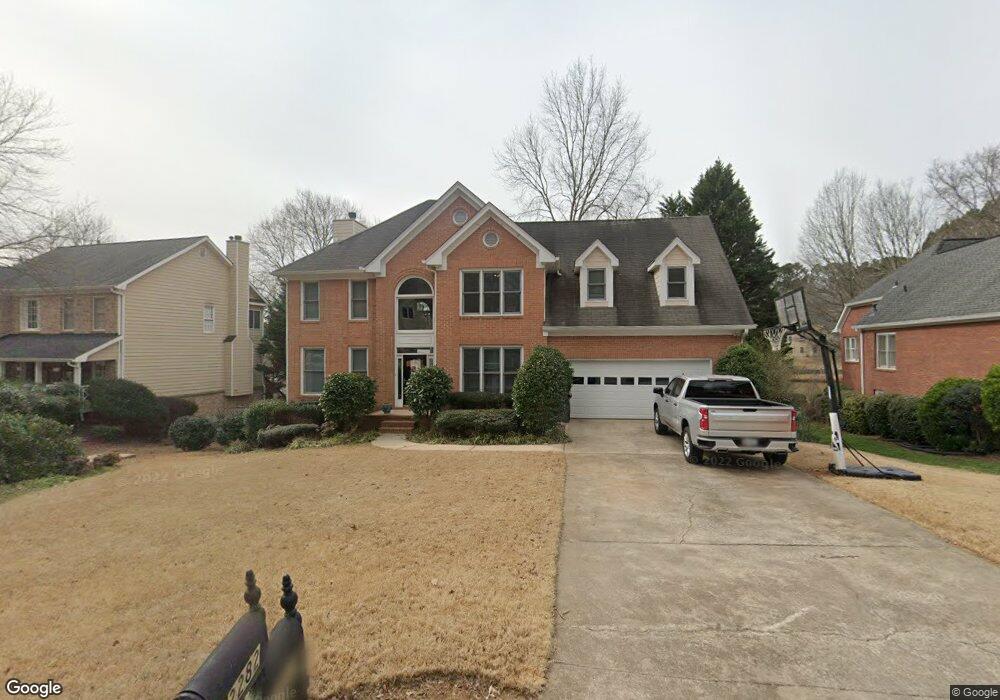
2282 Merrymount Dr Unit 2 Suwanee, GA 30024
Estimated Value: $543,703 - $595,000
4
Beds
3
Baths
2,576
Sq Ft
$220/Sq Ft
Est. Value
About This Home
This home is located at 2282 Merrymount Dr Unit 2, Suwanee, GA 30024 and is currently estimated at $567,176, approximately $220 per square foot. 2282 Merrymount Dr Unit 2 is a home located in Gwinnett County with nearby schools including Walnut Grove Elementary School, Creekland Middle School, and Collins Hill High School.
Ownership History
Date
Name
Owned For
Owner Type
Purchase Details
Closed on
Dec 29, 1998
Sold by
O'Neil Timothy B and O'Neil Alana M
Bought by
Frisina Jeffrey V and Frisina Nancy A
Current Estimated Value
Home Financials for this Owner
Home Financials are based on the most recent Mortgage that was taken out on this home.
Original Mortgage
$175,000
Outstanding Balance
$38,635
Interest Rate
6.72%
Mortgage Type
New Conventional
Estimated Equity
$528,541
Purchase Details
Closed on
Jun 30, 1997
Sold by
Cason Charles A and Cason Jane H
Bought by
Oneil Timothy B and Oneil Alana
Home Financials for this Owner
Home Financials are based on the most recent Mortgage that was taken out on this home.
Original Mortgage
$228,000
Interest Rate
7.25%
Mortgage Type
New Conventional
Purchase Details
Closed on
May 4, 1993
Sold by
Rogers Larry R
Bought by
Cason Charles A Jane H
Home Financials for this Owner
Home Financials are based on the most recent Mortgage that was taken out on this home.
Original Mortgage
$168,000
Interest Rate
7.53%
Create a Home Valuation Report for This Property
The Home Valuation Report is an in-depth analysis detailing your home's value as well as a comparison with similar homes in the area
Home Values in the Area
Average Home Value in this Area
Purchase History
| Date | Buyer | Sale Price | Title Company |
|---|---|---|---|
| Frisina Jeffrey V | $265,000 | -- | |
| Oneil Timothy B | $240,000 | -- | |
| Cason Charles A Jane H | $210,000 | -- |
Source: Public Records
Mortgage History
| Date | Status | Borrower | Loan Amount |
|---|---|---|---|
| Open | Frisina Jeffrey V | $175,000 | |
| Previous Owner | Oneil Timothy B | $228,000 | |
| Previous Owner | Cason Charles A Jane H | $168,000 |
Source: Public Records
Tax History
| Year | Tax Paid | Tax Assessment Tax Assessment Total Assessment is a certain percentage of the fair market value that is determined by local assessors to be the total taxable value of land and additions on the property. | Land | Improvement |
|---|---|---|---|---|
| 2025 | $5,770 | $225,440 | $32,200 | $193,240 |
| 2024 | $5,443 | $201,720 | $38,400 | $163,320 |
| 2023 | $5,443 | $205,280 | $41,600 | $163,680 |
| 2022 | $4,983 | $180,880 | $37,200 | $143,680 |
| 2021 | $4,326 | $145,400 | $26,800 | $118,600 |
| 2020 | $4,359 | $145,400 | $26,800 | $118,600 |
| 2019 | $3,988 | $132,680 | $24,640 | $108,040 |
| 2018 | $3,766 | $122,120 | $24,640 | $97,480 |
| 2016 | $3,536 | $110,640 | $19,600 | $91,040 |
| 2015 | $3,528 | $108,960 | $19,600 | $89,360 |
| 2014 | -- | $108,960 | $19,600 | $89,360 |
Source: Public Records
Map
Nearby Homes
- 2164 Cape Liberty Dr
- 2347 Merrymount Dr
- 2012 Little River Dr Unit 1
- 2094 Cape Liberty Dr Unit 4
- 2382 Merrymount Dr Unit 2
- 2152 Merrymount Dr Unit 6
- 2251 Lake Haven Way
- 2165 Wildwood Lake Dr
- 2275 Shore View Way
- 2067 York River Way
- 30 Karen Camile Dr
- 291 Shore Dr
- 1985 Tyler Trace
- 2001 Stone Forest Dr
- 2272 Stag Run
- 441 Shore Dr
- 2390 Walnut Grove Way
- 1832 Shores Ridge Ct
- 511 Shore Dr NW
- 327 Lee Miller Dr
- 2272 Merrymount Dr
- 2292 Merrymount Dr Unit 2
- 2302 Merrymount Dr Unit 2
- 2262 Merrymount Dr
- 2287 Merrymount Dr
- 2297 Merrymount Dr Unit 2
- 2277 Merrymount Dr
- 2267 Merrymount Dr Unit 2
- 2252 Merrymount Dr
- 2307 Merrymount Dr
- 2312 Merrymount Dr
- 2224 Cape Liberty Dr Unit 1
- 2214 Cape Liberty Dr
- 2327 Merrymount Dr
- 2234 Cape Liberty Dr
- 2242 Merrymount Dr
- 2204 Cape Liberty Dr
- 2322 Merrymount Dr
- 2247 Merrymount Dr
- 261 Waterford Cove Dr
Your Personal Tour Guide
Ask me questions while you tour the home.