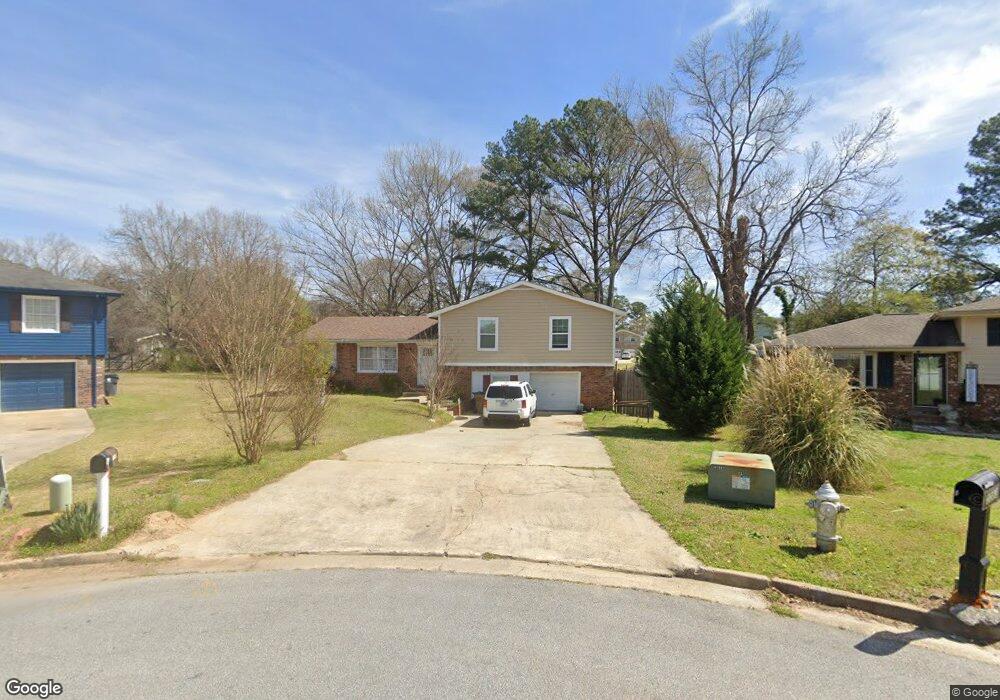
2282 Willoby Ct Unit 2 Morrow, GA 30260
Estimated Value: $190,000 - $226,000
3
Beds
2
Baths
1,442
Sq Ft
$141/Sq Ft
Est. Value
About This Home
This home is located at 2282 Willoby Ct Unit 2, Morrow, GA 30260 and is currently estimated at $203,642, approximately $141 per square foot. 2282 Willoby Ct Unit 2 is a home located in Clayton County with nearby schools including William M. Mcgarrah Elementary School, Morrow Middle School, and Morrow High School.
Ownership History
Date
Name
Owned For
Owner Type
Purchase Details
Closed on
Jun 5, 2019
Sold by
Morris Britaney
Bought by
Menjivar Juan
Current Estimated Value
Purchase Details
Closed on
Oct 9, 2015
Sold by
Reno Thomas L
Bought by
Morris Britaney
Purchase Details
Closed on
Dec 30, 1999
Sold by
Thomas Paul
Bought by
Reno Thomas L
Home Financials for this Owner
Home Financials are based on the most recent Mortgage that was taken out on this home.
Original Mortgage
$88,000
Interest Rate
6.98%
Mortgage Type
New Conventional
Purchase Details
Closed on
Jan 21, 1998
Sold by
Purcell William M
Bought by
Thomas Paul
Home Financials for this Owner
Home Financials are based on the most recent Mortgage that was taken out on this home.
Original Mortgage
$44,100
Interest Rate
10.5%
Mortgage Type
New Conventional
Create a Home Valuation Report for This Property
The Home Valuation Report is an in-depth analysis detailing your home's value as well as a comparison with similar homes in the area
Home Values in the Area
Average Home Value in this Area
Purchase History
| Date | Buyer | Sale Price | Title Company |
|---|---|---|---|
| Menjivar Juan | -- | -- | |
| Morris Britaney | $3,000 | -- | |
| Reno Thomas L | -- | -- | |
| Thomas Paul | $26,000 | -- |
Source: Public Records
Mortgage History
| Date | Status | Borrower | Loan Amount |
|---|---|---|---|
| Previous Owner | Reno Thomas L | $88,000 | |
| Previous Owner | Thomas Paul | $44,100 |
Source: Public Records
Tax History
| Year | Tax Paid | Tax Assessment Tax Assessment Total Assessment is a certain percentage of the fair market value that is determined by local assessors to be the total taxable value of land and additions on the property. | Land | Improvement |
|---|---|---|---|---|
| 2025 | $3,026 | $79,000 | $8,000 | $71,000 |
| 2024 | $3,096 | $79,360 | $8,000 | $71,360 |
| 2023 | $2,639 | $73,080 | $8,000 | $65,080 |
| 2022 | $2,440 | $62,160 | $8,000 | $54,160 |
| 2021 | $1,814 | $45,920 | $8,000 | $37,920 |
| 2020 | $1,148 | $42,315 | $8,000 | $34,315 |
| 2019 | $1,545 | $38,068 | $6,400 | $31,668 |
| 2018 | $1,453 | $35,782 | $6,400 | $29,382 |
| 2017 | $1,250 | $30,711 | $6,400 | $24,311 |
| 2016 | $49 | $1,200 | $800 | $400 |
| 2015 | $903 | $0 | $0 | $0 |
| 2014 | $998 | $25,096 | $6,400 | $18,696 |
Source: Public Records
Map
Nearby Homes
- 6566 Melandre Dr
- 6413 Maddox Rd
- 6560 Maddox Rd
- 6495 Revena Dr
- 6418 Maddox Rd
- 6614 Melandre Dr
- 6359 Lanier Rd
- 6633 Cameron Rd
- 6364 Maddox Rd
- 2117 Amish Ct
- 2542 Burton Cir
- 2497 Celina Ct
- 2455 Lake Harbin Rd
- 2509 Bonita Ct
- 2617 Terrace Pkwy
- 2571 Stratford Ln Unit 2LH
- 2575 Stratford Ln
- 2613 Stratford Ln Unit 3
- 6584 Sleepy Hollow Ln
- 6532 Debbie Sue Ln
- 2278 Willoby Ct Unit 2
- 2283 Willoby Ct
- 6495 Fleming Rd
- 6501 Fleming Rd Unit 2
- 6487 Fleming Rd
- 2272 Willoby Ct
- 2277 Willoby Ct
- 6509 Fleming Rd
- 2285 Lanier Place
- 2293 Lanier Place
- 2277 Lanier Place
- 2273 Willoby Ct Unit 2
- 2299 Lanier Place
- 6517 Fleming Rd
- 2264 Willoby Ct Unit 2
- 2269 Lanier Place
- 2265 Willoby Ct
- 6519 Melandre Dr
- 6523 Melandre Dr
- 6515 Melandre Dr
Your Personal Tour Guide
Ask me questions while you tour the home.