2283 S Depew St Denver, CO 80227
Thraemoor NeighborhoodEstimated Value: $694,000 - $718,000
4
Beds
7
Baths
1,970
Sq Ft
$360/Sq Ft
Est. Value
About This Home
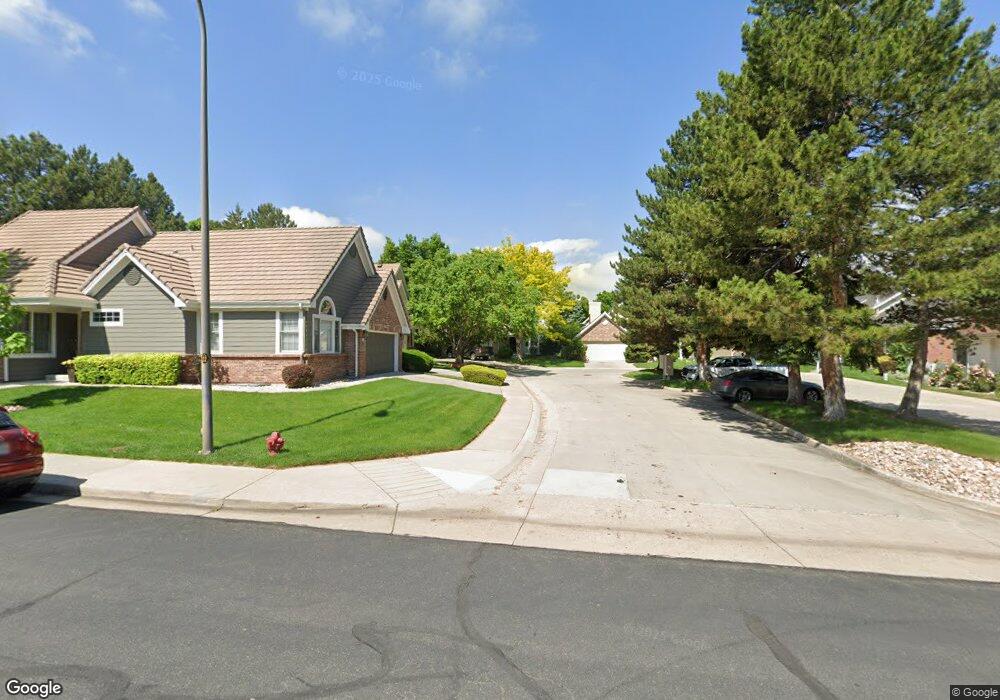
This home is located at 2283 S Depew St, Denver, CO 80227 and is currently estimated at $710,093, approximately $360 per square foot. 2283 S Depew St is a home located in Jefferson County with nearby schools including Lasley Elementary School, Alameda International High School, and Notre Dame Parish Catholic School.
Ownership History
Date
Name
Owned For
Owner Type
Purchase Details
Closed on
Aug 22, 2019
Sold by
Danielle Dawn and Moore Debbie
Bought by
Moore Debbie
Current Estimated Value
Home Financials for this Owner
Home Financials are based on the most recent Mortgage that was taken out on this home.
Original Mortgage
$205,000
Outstanding Balance
$179,542
Interest Rate
3.7%
Mortgage Type
New Conventional
Estimated Equity
$530,551
Purchase Details
Closed on
Dec 11, 2013
Sold by
Moore Debbie and Molden Dawn Danielle
Bought by
Moore Debbie and Molden Dawn Danielle
Purchase Details
Closed on
Mar 1, 2008
Sold by
Moore Debbie
Bought by
Moore Debbie and Molden Dawn Danielle
Purchase Details
Closed on
Sep 15, 1995
Sold by
Sadler Virginia F and Sadler Dean L
Bought by
Delamorton Orlean Lindsay
Purchase Details
Closed on
Oct 5, 1993
Sold by
Sadler Dean L
Bought by
Sadler Deal L and Sadler Virginia F
Create a Home Valuation Report for This Property
The Home Valuation Report is an in-depth analysis detailing your home's value as well as a comparison with similar homes in the area
Home Values in the Area
Average Home Value in this Area
Purchase History
| Date | Buyer | Sale Price | Title Company |
|---|---|---|---|
| Moore Debbie | -- | Canyon Title | |
| Moore Debbie | -- | None Available | |
| Moore Debbie | -- | None Available | |
| Moore Debbie | -- | None Available | |
| Delamorton Orlean Lindsay | $190,000 | First American Heritage Titl | |
| Sadler Virginia F | -- | First American Heritage Titl | |
| Sadler Deal L | -- | -- |
Source: Public Records
Mortgage History
| Date | Status | Borrower | Loan Amount |
|---|---|---|---|
| Open | Moore Debbie | $205,000 |
Source: Public Records
Tax History Compared to Growth
Tax History
| Year | Tax Paid | Tax Assessment Tax Assessment Total Assessment is a certain percentage of the fair market value that is determined by local assessors to be the total taxable value of land and additions on the property. | Land | Improvement |
|---|---|---|---|---|
| 2024 | $3,104 | $40,721 | $13,666 | $27,055 |
| 2023 | $3,104 | $40,721 | $13,666 | $27,055 |
| 2022 | $2,622 | $34,994 | $11,849 | $23,145 |
| 2021 | $2,659 | $36,001 | $12,190 | $23,811 |
| 2020 | $3,099 | $33,742 | $7,964 | $25,778 |
| 2019 | $3,060 | $33,742 | $7,964 | $25,778 |
| 2018 | $3,032 | $32,300 | $9,462 | $22,838 |
| 2017 | $2,670 | $32,300 | $9,462 | $22,838 |
| 2016 | $2,799 | $31,556 | $6,769 | $24,787 |
| 2015 | $2,314 | $31,556 | $6,769 | $24,787 |
| 2014 | $2,314 | $23,916 | $6,627 | $17,289 |
Source: Public Records
Map
Nearby Homes
- 5317 W Iliff Dr Unit 101
- 5661 W Lakeridge Rd
- 5241 W Iliff Dr Unit 5241
- 2123 S Gray St
- 6022 W Warren Ct
- 5741 W Asbury Place Unit 104
- 2595 S Harlan Ct
- 5875 W Asbury Place Unit 103
- 2684 S Benton St
- 5732 W Atlantic Place Unit 102
- 5725 W Atlantic Place Unit 308
- 5725 W Atlantic Place Unit 103
- 2650 S Sheridan Ct Unit 2
- 5735 W Atlantic Place Unit 101
- 2562 S Xavier St
- 2630 S Wolff Way
- 2713 S Depew St
- 5860 W Atlantic Dr
- 5775 W Atlantic Place Unit 303
- 5745 W Atlantic Place Unit 104
- 2275 S Depew St
- 2285 S Depew St
- 5625 W Iliff Dr
- 2293 S Depew St
- 5627 W Iliff Dr
- 2273 S Depew St
- 5623 W Iliff Dr
- 5633 W Iliff Dr
- 5635 W Iliff Dr
- 2263 S Depew St
- 5630 W Warren Ave
- 2302 S Eaton Ct
- 5594 W Iliff Dr
- 5637 W Iliff Dr
- 5584 W Iliff Dr
- 5645 W Iliff Dr
- 5720 W Warren Ave
- 5431 W Iliff Dr Unit 8B5431
- 5647 W Iliff Dr
- 2292 S Depew St Unit 2292