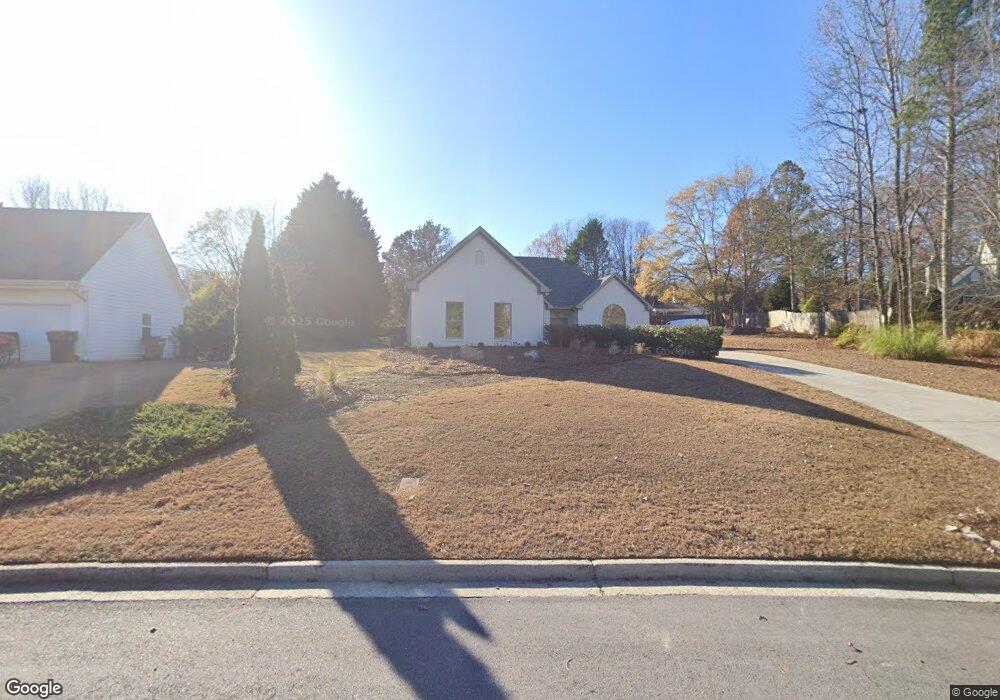
2283 Silver Fox Ln Unit 1 Buford, GA 30519
Estimated Value: $421,000 - $483,000
3
Beds
2
Baths
2,094
Sq Ft
$216/Sq Ft
Est. Value
About This Home
This home is located at 2283 Silver Fox Ln Unit 1, Buford, GA 30519 and is currently estimated at $452,460, approximately $216 per square foot. 2283 Silver Fox Ln Unit 1 is a home located in Gwinnett County with nearby schools including Harmony Elementary School and Glenn C. Jones Middle School.
Ownership History
Date
Name
Owned For
Owner Type
Purchase Details
Closed on
Sep 15, 2011
Sold by
Wells Fargo Bank Na Truste
Bought by
Boldea Samuel and Boldea Estera D
Current Estimated Value
Home Financials for this Owner
Home Financials are based on the most recent Mortgage that was taken out on this home.
Original Mortgage
$103,200
Outstanding Balance
$71,099
Interest Rate
4.54%
Mortgage Type
New Conventional
Estimated Equity
$381,361
Purchase Details
Closed on
May 3, 2011
Sold by
Michael Sydney L
Bought by
Wells Fargo Bk Series 2006-Nc4
Purchase Details
Closed on
Aug 15, 2002
Sold by
Carroll Gene
Bought by
Michael Sydney L
Home Financials for this Owner
Home Financials are based on the most recent Mortgage that was taken out on this home.
Original Mortgage
$171,000
Interest Rate
6.53%
Purchase Details
Closed on
Jul 29, 2002
Sold by
Harrison Don G
Bought by
Carroll Gene
Home Financials for this Owner
Home Financials are based on the most recent Mortgage that was taken out on this home.
Original Mortgage
$171,000
Interest Rate
6.53%
Create a Home Valuation Report for This Property
The Home Valuation Report is an in-depth analysis detailing your home's value as well as a comparison with similar homes in the area
Home Values in the Area
Average Home Value in this Area
Purchase History
| Date | Buyer | Sale Price | Title Company |
|---|---|---|---|
| Boldea Samuel | $129,000 | -- | |
| Wells Fargo Bk Series 2006-Nc4 | $170,000 | -- | |
| Michael Sydney L | $181,000 | -- | |
| Carroll Gene | -- | -- |
Source: Public Records
Mortgage History
| Date | Status | Borrower | Loan Amount |
|---|---|---|---|
| Open | Boldea Samuel | $103,200 | |
| Previous Owner | Michael Sydney L | $171,000 |
Source: Public Records
Tax History
| Year | Tax Paid | Tax Assessment Tax Assessment Total Assessment is a certain percentage of the fair market value that is determined by local assessors to be the total taxable value of land and additions on the property. | Land | Improvement |
|---|---|---|---|---|
| 2025 | $4,549 | $165,720 | $40,000 | $125,720 |
| 2024 | $4,335 | $148,840 | $39,200 | $109,640 |
| 2023 | $4,335 | $163,880 | $39,200 | $124,680 |
| 2022 | $3,975 | $133,160 | $27,960 | $105,200 |
| 2021 | $3,405 | $102,920 | $27,960 | $74,960 |
| 2020 | $3,282 | $96,200 | $23,840 | $72,360 |
| 2019 | $3,193 | $96,200 | $23,840 | $72,360 |
| 2018 | $3,014 | $87,880 | $18,400 | $69,480 |
| 2016 | $2,797 | $76,880 | $14,800 | $62,080 |
| 2015 | $2,827 | $76,880 | $14,800 | $62,080 |
| 2014 | -- | $66,440 | $14,800 | $51,640 |
Source: Public Records
Map
Nearby Homes
- 2262 Silver Fox Ln
- 2380 Black Bear Ct
- 2249 White Alder Dr
- 2140 Harvest Ridge Cir
- 3843 Morning Meadow Ln
- 3534 Fallen Oak Ln
- 2727 Lost Mill Trace
- 3503 Fallen Oak Dr
- 1970 Sturbridge Ln Unit 1
- 3663 Lost Oak Dr
- 2287 Tortuga Pass
- 2151 E Maddox Rd
- 2395 Kilgore Rd
- 3685 Rolling Creek Dr
- 2190 Copper Trail Ln
- 4041 Lost Mill Ln
- 2550 Kilgore Rd
- 2148 Splitrail Trail
- 3400 Coles Creek Dr
- 3665 Mystic Dr Unit 2
- 2293 Silver Fox Ln Unit 1
- 2273 Silver Fox Ln
- 3588 Silver Fox Path Unit 5
- 2263 Silver Fox Ln
- 3548 Silver Fox Path
- 3558 Silver Fox Path
- 2272 Silver Fox Ln
- 2292 Silver Fox Ln
- 3538 Silver Fox Path Unit 1
- 2279 Fox Run Trail
- 3619 Silver Fox Path
- 3609 Silver Fox Path
- 3629 Silver Fox Path Unit 1
- 3658 Silver Fox Path
- 2289 Fox Run Trail
- 3589 Silver Fox Path Unit 1
- 3599 Silver Fox Path
- 3528 Silver Fox Path Unit 1
- 3539 Silver Fox Path Unit 1
- 3639 Silver Fox Path
Your Personal Tour Guide
Ask me questions while you tour the home.