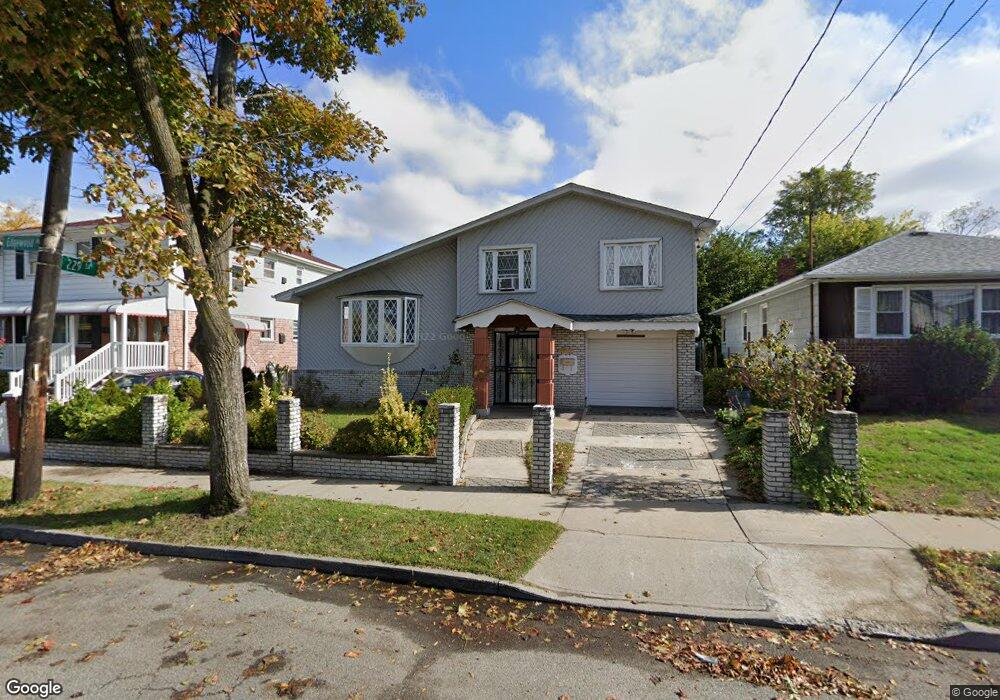
22831 Edgewood Ave Springfield Gardens, NY 11413
Brookville NeighborhoodEstimated Value: $698,000 - $809,000
--
Bed
--
Bath
1,720
Sq Ft
$444/Sq Ft
Est. Value
About This Home
This home is located at 22831 Edgewood Ave, Springfield Gardens, NY 11413 and is currently estimated at $764,119, approximately $444 per square foot. 22831 Edgewood Ave is a home located in Queens County with nearby schools including P.S. 181 Brookfield, Collaborative Arts Middle School, and Linden Seventh-Day Adventist School.
Ownership History
Date
Name
Owned For
Owner Type
Purchase Details
Closed on
Oct 2, 2013
Sold by
786 K & C Llc
Bought by
Savory Nigel and Savory Sophia
Current Estimated Value
Home Financials for this Owner
Home Financials are based on the most recent Mortgage that was taken out on this home.
Original Mortgage
$387,845
Outstanding Balance
$292,339
Interest Rate
4.58%
Mortgage Type
New Conventional
Estimated Equity
$471,780
Purchase Details
Closed on
Jun 28, 2012
Sold by
The Bank Of New York Mellon
Bought by
786 K & C Llc
Purchase Details
Closed on
Dec 8, 2009
Sold by
Darche Esq Referee Gary M
Bought by
The Bank Of New York Mellon
Purchase Details
Closed on
Jan 11, 1999
Sold by
Mcfarlane Percival and Gilkes Doreen
Bought by
Mcfarlane Percival
Home Financials for this Owner
Home Financials are based on the most recent Mortgage that was taken out on this home.
Original Mortgage
$16,632
Interest Rate
6.88%
Mortgage Type
Stand Alone Second
Create a Home Valuation Report for This Property
The Home Valuation Report is an in-depth analysis detailing your home's value as well as a comparison with similar homes in the area
Home Values in the Area
Average Home Value in this Area
Purchase History
| Date | Buyer | Sale Price | Title Company |
|---|---|---|---|
| Savory Nigel | $400,000 | -- | |
| Savory Nigel | $400,000 | -- | |
| 786 K & C Llc | $267,397 | -- | |
| 786 K & C Llc | $267,397 | -- | |
| The Bank Of New York Mellon | $1,000 | -- | |
| The Bank Of New York Mellon | $1,000 | -- | |
| Mcfarlane Percival | -- | Stewart Title Insurance Co | |
| Mcfarlane Percival | -- | Stewart Title Insurance Co |
Source: Public Records
Mortgage History
| Date | Status | Borrower | Loan Amount |
|---|---|---|---|
| Open | Savory Nigel | $387,845 | |
| Closed | Savory Nigel | $387,845 | |
| Previous Owner | Mcfarlane Percival | $16,632 |
Source: Public Records
Tax History Compared to Growth
Tax History
| Year | Tax Paid | Tax Assessment Tax Assessment Total Assessment is a certain percentage of the fair market value that is determined by local assessors to be the total taxable value of land and additions on the property. | Land | Improvement |
|---|---|---|---|---|
| 2025 | $6,334 | $33,428 | $6,511 | $26,917 |
| 2024 | $6,334 | $31,536 | $6,858 | $24,678 |
| 2023 | $6,334 | $31,536 | $6,515 | $25,021 |
| 2022 | $6,248 | $37,980 | $9,420 | $28,560 |
| 2021 | $6,214 | $34,740 | $9,420 | $25,320 |
| 2020 | $5,897 | $34,680 | $9,420 | $25,260 |
| 2019 | $5,498 | $32,520 | $9,420 | $23,100 |
| 2018 | $5,357 | $26,280 | $7,251 | $19,029 |
| 2017 | $5,317 | $26,082 | $7,378 | $18,704 |
| 2016 | $4,919 | $26,082 | $7,378 | $18,704 |
| 2015 | $2,997 | $23,214 | $6,943 | $16,271 |
| 2014 | $2,997 | $21,900 | $7,860 | $14,040 |
Source: Public Records
Map
Nearby Homes
- 22820 Edgewood Ave
- 143-56 229th St
- 142-29 230th Place
- 143-27 230th Place
- 14419 230 St
- 14426 229th St
- 229-11 141st Ave
- 144-23 231st St
- 139-55 230th Place Unit 55
- 143-08 224th St
- 14437 231st St
- 225-19 141st Ave
- 224-14 141st Ave
- 139-23 230th St
- 139-16 230th Place
- 142-16 223rd St
- 139-18 232nd St
- 144-49 223rd St
- 145-22 232nd St
- 233-1 Mentone Ave
- 22835 Edgewood Ave
- 22827 Edgewood Ave
- 22827 Edgewood Ave
- 23070 Edgewood Ave
- 228-27 Edgewood Ave
- 22905 Edgewood Ave
- 22823 Edgewood Ave
- 228-23 Edgewood Ave
- 22920 S Conduit Ave
- 22909 Edgewood Ave
- 22909 Edgewood Ave
- 229-24 Edgewood Ave
- 143-33 229th St
- 14333 229th St
- 14333 229th St
- 22826 Edgewood Ave
- 22915 Edgewood Ave
- 23012 Lansing Ave
- 22824 Edgewood Ave