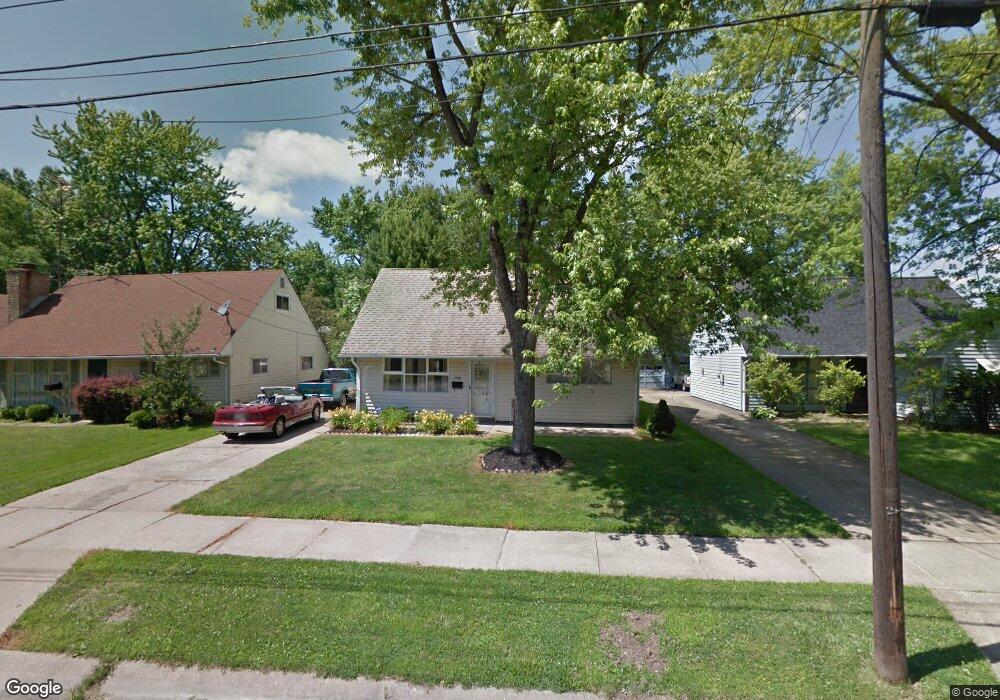
2284 Stephens Ave NW Warren, OH 44485
Austin Village NeighborhoodEstimated Value: $79,000 - $97,000
3
Beds
1
Bath
1,036
Sq Ft
$84/Sq Ft
Est. Value
About This Home
This home is located at 2284 Stephens Ave NW, Warren, OH 44485 and is currently estimated at $87,383, approximately $84 per square foot. 2284 Stephens Ave NW is a home located in Trumbull County with nearby schools including McGuffey School, Warren G. Harding High School, and Steam Academy of Warren.
Ownership History
Date
Name
Owned For
Owner Type
Purchase Details
Closed on
Dec 7, 2017
Sold by
Butler Durst Deborah and Butler Deborah
Bought by
Durst Steven C
Current Estimated Value
Purchase Details
Closed on
Oct 8, 2008
Sold by
Jarvis Lindsy
Bought by
Durst Steven C and Butler Durst Deborah
Home Financials for this Owner
Home Financials are based on the most recent Mortgage that was taken out on this home.
Original Mortgage
$49,348
Outstanding Balance
$32,815
Interest Rate
6.43%
Mortgage Type
FHA
Estimated Equity
$54,568
Purchase Details
Closed on
Mar 11, 2008
Sold by
Fannie Mae
Bought by
Jarvis Lindsy
Purchase Details
Closed on
Dec 27, 2007
Sold by
Mihalov Paul J and Trumbull County Treasurer
Bought by
Federal National Mortgage Association
Purchase Details
Closed on
Jul 16, 2001
Sold by
Booth Paulette J and Logan Mary Theresa
Bought by
Mihalov Paul J
Purchase Details
Closed on
Jan 1, 1990
Bought by
Lucy S Mihalov
Create a Home Valuation Report for This Property
The Home Valuation Report is an in-depth analysis detailing your home's value as well as a comparison with similar homes in the area
Home Values in the Area
Average Home Value in this Area
Purchase History
| Date | Buyer | Sale Price | Title Company |
|---|---|---|---|
| Durst Steven C | -- | None Available | |
| Durst Steven C | $50,000 | None Available | |
| Jarvis Lindsy | $10,500 | Accutitle Agency Inc | |
| Federal National Mortgage Association | $30,000 | None Available | |
| Mihalov Paul J | -- | -- | |
| Lucy S Mihalov | -- | -- |
Source: Public Records
Mortgage History
| Date | Status | Borrower | Loan Amount |
|---|---|---|---|
| Open | Durst Steven C | $49,348 |
Source: Public Records
Tax History Compared to Growth
Tax History
| Year | Tax Paid | Tax Assessment Tax Assessment Total Assessment is a certain percentage of the fair market value that is determined by local assessors to be the total taxable value of land and additions on the property. | Land | Improvement |
|---|---|---|---|---|
| 2024 | $908 | $18,450 | $2,100 | $16,350 |
| 2023 | $908 | $18,450 | $2,100 | $16,350 |
| 2022 | $880 | $13,970 | $2,100 | $11,870 |
| 2021 | $882 | $13,970 | $2,100 | $11,870 |
| 2020 | $883 | $13,970 | $2,100 | $11,870 |
| 2019 | $893 | $13,410 | $2,100 | $11,310 |
| 2018 | $890 | $13,410 | $2,100 | $11,310 |
| 2017 | $876 | $13,410 | $2,100 | $11,310 |
| 2016 | $787 | $12,470 | $2,770 | $9,700 |
| 2015 | $781 | $12,470 | $2,770 | $9,700 |
| 2014 | $777 | $12,470 | $2,770 | $9,700 |
| 2013 | $920 | $15,550 | $2,770 | $12,780 |
Source: Public Records
Map
Nearby Homes
- 2144 Northwest Blvd NW
- 1727 Lexington Ave NW
- 1552 Denison Ave NW
- 2879 Linda Dr NW
- 1945 Norwood St NW
- 1936 Norwood St NW
- 1647 Southern Blvd NW
- 2931 Randolph St NW
- 1325 Moncrest Dr NW
- 1166 Raymond St NW
- 1351 Bradford St NW
- 1331 Bradford St NW
- 1056 Orlo Dr NW
- 3000 Parkman Rd NW
- 1315 Westwood Dr NW
- 666 Dickey Ave NW
- 983 Garden St NW
- 806 Parkman Rd NW
- 3768 Tod Ave NW
- 2821 Tod Ave NW
- 2294 Stephens Ave NW
- 2274 Stephens Ave NW
- 2304 Stephens Ave NW
- 2264 Stephens Ave NW
- 2331 Linda Dr NW
- 2254 Stephens Ave NW
- 2314 Stephens Ave NW
- 2341 Linda Dr NW
- 2321 Linda Dr NW
- 2351 Linda Dr NW
- 2311 Linda Dr NW
- 2281 Stephens Ave NW
- 2293 Stephens Ave NW
- 2244 Stephens Ave NW
- 2324 Stephens Ave NW
- 2271 Stephens Ave NW
- 2301 Linda Dr NW
- 2361 Linda Dr NW
- 2303 Stephens Ave NW
- 2259 Stephens Ave NW