Estimated Value: $160,000 - $237,000
3
Beds
2
Baths
1,317
Sq Ft
$143/Sq Ft
Est. Value
About This Home
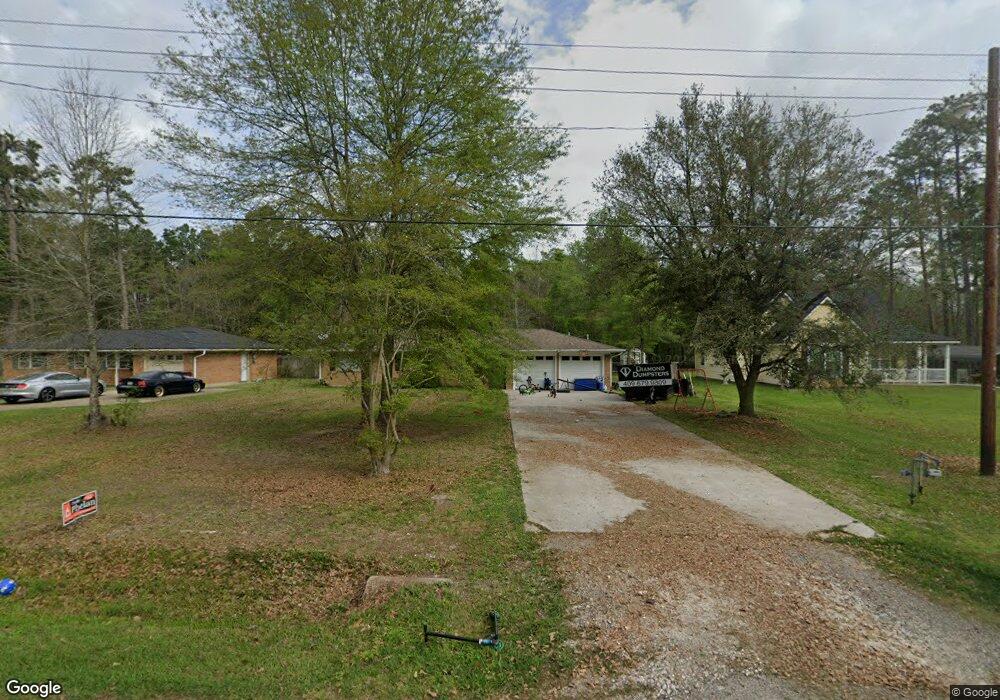
This home is located at 2285 Brightwood Dr, Vidor, TX 77662 and is currently estimated at $188,523, approximately $143 per square foot. 2285 Brightwood Dr is a home located in Orange County with nearby schools including Faith Christian Academy.
Ownership History
Date
Name
Owned For
Owner Type
Purchase Details
Closed on
Jan 17, 2019
Sold by
Viator Chelsea and Viator Derrick
Bought by
Comeaux Bryan and Brown Hallie
Current Estimated Value
Purchase Details
Closed on
Aug 5, 2016
Sold by
Martin Brandon and Martin Rachel
Bought by
Hammonds Chelsea B
Purchase Details
Closed on
Jun 19, 2015
Sold by
Wells Fargo Bank Na
Bought by
Martin Brandon and Martin Rachel
Purchase Details
Closed on
Feb 3, 2015
Sold by
Mulhall Jessica Leigh
Bought by
Wells Fargo Bank Na
Purchase Details
Closed on
Jun 26, 2013
Sold by
Jost Christopher T and Jost Jennifer C
Bought by
Mulhall Jessica Leigh
Purchase Details
Closed on
Jun 29, 2007
Sold by
Billingsley Walter
Bought by
Jost Christopher T and Jost Jennifer C
Create a Home Valuation Report for This Property
The Home Valuation Report is an in-depth analysis detailing your home's value as well as a comparison with similar homes in the area
Home Values in the Area
Average Home Value in this Area
Purchase History
| Date | Buyer | Sale Price | Title Company |
|---|---|---|---|
| Comeaux Bryan | -- | Capital Title | |
| Comeaux Bryan | -- | Capital Title | |
| Hammonds Chelsea B | -- | None Available | |
| Hammonds Chelsea B | -- | None Available | |
| Martin Brandon | -- | Fidelity Natl Title Agency I | |
| Hammonds Chelsea B | -- | -- | |
| Martin Brandon | -- | Fidelity Natl Title Agency I | |
| Hammonds Chelsea B | -- | -- | |
| Wells Fargo Bank Na | $77,600 | None Available | |
| Hammonds Chelsea B | -- | -- | |
| Wells Fargo Bank Na | $77,600 | None Available | |
| Hammonds Chelsea B | -- | -- | |
| Mulhall Jessica Leigh | -- | None Available | |
| Mulhall Jessica Leigh | -- | None Available | |
| Jost Christopher T | -- | Sabine Title Co | |
| Jost Christopher T | -- | Sabine Title Co |
Source: Public Records
Tax History Compared to Growth
Tax History
| Year | Tax Paid | Tax Assessment Tax Assessment Total Assessment is a certain percentage of the fair market value that is determined by local assessors to be the total taxable value of land and additions on the property. | Land | Improvement |
|---|---|---|---|---|
| 2025 | $3,627 | $146,615 | $4,888 | $141,727 |
| 2024 | $3,627 | $146,615 | $4,888 | $141,727 |
| 2023 | $4,350 | $171,936 | $4,888 | $167,048 |
| 2022 | $4,383 | $156,838 | $4,888 | $151,950 |
| 2021 | $4,272 | $143,098 | $4,888 | $138,210 |
| 2020 | $3,981 | $131,068 | $4,888 | $126,180 |
| 2019 | $3,394 | $110,628 | $4,888 | $105,740 |
| 2018 | $3,158 | $105,508 | $4,888 | $100,620 |
| 2017 | $2,443 | $105,508 | $4,888 | $100,620 |
| 2016 | $2,321 | $76,788 | $4,888 | $71,900 |
| 2015 | $2,219 | $72,859 | $4,888 | $67,971 |
| 2014 | $2,219 | $70,951 | $4,888 | $66,063 |
Source: Public Records
Map
Nearby Homes
- 285 Lakewood Dr
- 0 School Rd
- 235 Jennings Rd
- 1560 Posey Ln
- 490 Concord St Unit 485 Lexington
- 18185 Ih 10
- 2665 Lincoln St
- 605 N Lakeside St
- 835 Strickland St
- 250 Oakland Dr
- tbd Oakland St
- 18046 Interstate 10
- 305 Oakland Dr
- 1110 S Lakeside St
- 2950 Highway 90
- 955 Aery Rd
- 2950 Old Highway 90 E
- 16595 Interstate 10
- 1150 S Timberlane
- 970 S Mayhaw Dr
- 2285 Brightwood St
- 2295 Brightwood St
- 2255 Brightwood St
- 2245 Brightwood St
- 550 Sherwood St
- 505 Sherwood St
- 460 Rosewood St
- 440 Rosewood St
- 420 Rosewood St
- 525 Sherwood St
- 520 Rosewood St
- 415 Rosewood St
- 540 Sherwood St
- 0000 Rosewood St
- 0000 Rosewood St
- 00000 Rosewood St
- 00 Rosewood St
- 000 Rosewood St
- 545 Sherwood St
- 525 Rosewood St