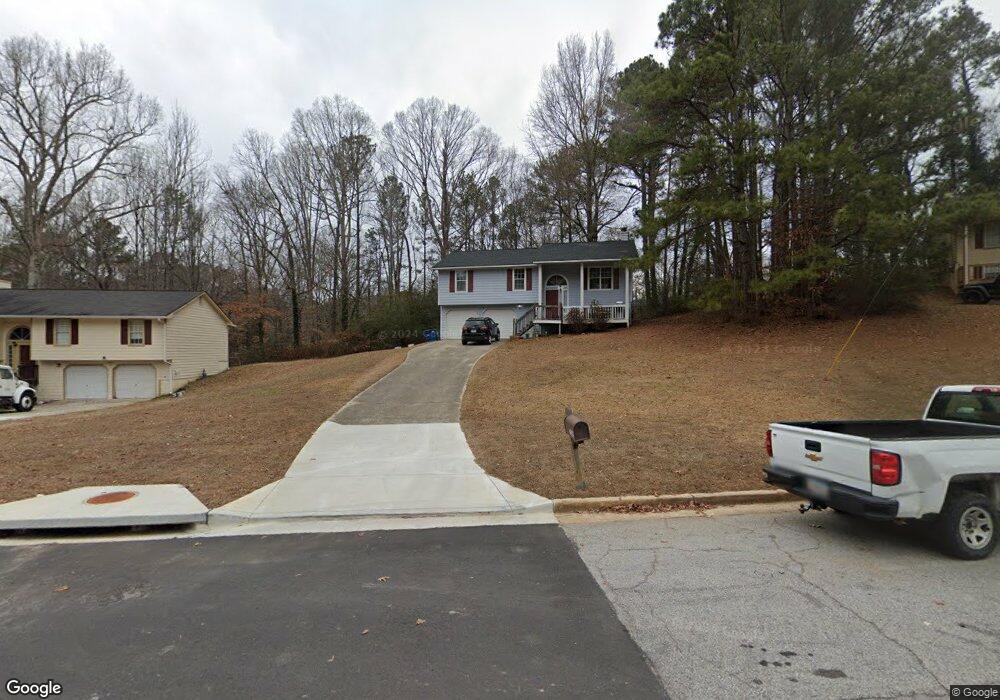
2285 Chestnut Place Lithia Springs, GA 30122
Lithia Springs NeighborhoodEstimated Value: $184,000 - $287,000
5
Beds
3
Baths
1,164
Sq Ft
$202/Sq Ft
Est. Value
About This Home
This home is located at 2285 Chestnut Place, Lithia Springs, GA 30122 and is currently estimated at $234,644, approximately $201 per square foot. 2285 Chestnut Place is a home located in Douglas County with nearby schools including Sweetwater Elementary School, Factory Shoals Middle School, and Lithia Springs Comprehensive High School.
Ownership History
Date
Name
Owned For
Owner Type
Purchase Details
Closed on
Apr 28, 2022
Sold by
Mark Phillips
Bought by
Phillips Amanda
Current Estimated Value
Purchase Details
Closed on
May 14, 2014
Sold by
Phillips Christopher S
Bought by
Phillips Mark
Purchase Details
Closed on
Jan 6, 2014
Sold by
Phillips Janice C
Bought by
Phillips Christopher S and Phillips Mark
Purchase Details
Closed on
Mar 11, 2009
Sold by
Federal Natl Mtg Assn Fnma
Bought by
Phillips Janice C
Purchase Details
Closed on
Oct 7, 2008
Sold by
Countrywide Hm Lns Inc
Bought by
Federal Natl Mtg Assn Fnma
Purchase Details
Closed on
Feb 5, 2008
Sold by
Lewis Timothy B and Lewis Timothy R
Bought by
First Franklin Trust 2007-Ff1
Purchase Details
Closed on
Apr 30, 2007
Sold by
Kiyani Masood H
Bought by
Robinson Sheniqua L
Home Financials for this Owner
Home Financials are based on the most recent Mortgage that was taken out on this home.
Original Mortgage
$129,000
Interest Rate
6.11%
Mortgage Type
New Conventional
Create a Home Valuation Report for This Property
The Home Valuation Report is an in-depth analysis detailing your home's value as well as a comparison with similar homes in the area
Home Values in the Area
Average Home Value in this Area
Purchase History
| Date | Buyer | Sale Price | Title Company |
|---|---|---|---|
| Phillips Amanda | -- | None Listed On Document | |
| Phillips Mark | -- | -- | |
| Phillips Christopher S | -- | -- | |
| Phillips Janice C | -- | -- | |
| Federal Natl Mtg Assn Fnma | -- | -- | |
| Countrywide Hm Lns Inc | $118,052 | -- | |
| First Franklin Trust 2007-Ff1 | $172,400 | -- | |
| Robinson Sheniqua L | $129,000 | -- |
Source: Public Records
Mortgage History
| Date | Status | Borrower | Loan Amount |
|---|---|---|---|
| Previous Owner | Robinson Sheniqua L | $129,000 |
Source: Public Records
Tax History Compared to Growth
Tax History
| Year | Tax Paid | Tax Assessment Tax Assessment Total Assessment is a certain percentage of the fair market value that is determined by local assessors to be the total taxable value of land and additions on the property. | Land | Improvement |
|---|---|---|---|---|
| 2024 | $1,598 | $50,800 | $12,000 | $38,800 |
| 2023 | $1,598 | $51,360 | $12,000 | $39,360 |
| 2022 | $1,726 | $53,000 | $12,000 | $41,000 |
| 2021 | $1,498 | $45,920 | $12,600 | $33,320 |
| 2020 | $1,523 | $45,920 | $12,600 | $33,320 |
| 2019 | $1,393 | $45,000 | $12,600 | $32,400 |
| 2018 | $1,179 | $37,880 | $10,920 | $26,960 |
| 2017 | $1,103 | $34,760 | $10,920 | $23,840 |
| 2016 | $1,085 | $33,640 | $10,920 | $22,720 |
| 2015 | $914 | $28,920 | $9,600 | $19,320 |
| 2014 | $914 | $27,200 | $9,600 | $17,600 |
| 2013 | -- | $26,960 | $9,600 | $17,360 |
Source: Public Records
Map
Nearby Homes
- 2275 Chestnut Log Loop
- 2087 Chestnut Way
- 2322 Chestnut Log Loop
- 2344 Mount Vernon Rd
- 1940 Lee
- 2499 Chestnut Log Loop
- 8684 Hickory Ln
- 3570 Briar Dr
- 1815 Lee Rd
- LOT 27 Chestnut Ln
- 2182 Ann Ln
- 3460 Meadowview Dr
- 3646 Briar Dr
- 3652 Sweetbriar Cir
- 3552 Meadowview Dr
- 3686 Sweetbriar Cir
- 2436 Falls River Dr
- 3790 Sweetbriar Cir
- 2435 Arlington Ct
- HAYDEN Plan at Fairhaven
- 2279 Chestnut Place
- 2289 Chestnut Place Unit 2289
- 2289 Chestnut Place
- 2202 Chestnut Log Dr
- 2298 Chestnut Place
- 2216 Chestnut Log Dr
- 2192 Chestnut Log Dr
- 2275 Chestnut Place
- 2284 Chestnut Place
- 2274 Chestnut Place
- 2182 Chestnut Log Dr
- 2294 Chestnut Place
- 2264 Chestnut Place
- 2556 Chestnut Log Dr
- 2256 Chestnut Log Dr
- 2160 Chestnut Place
- 2271 Chestnut Place
- 2152 Chestnut Place
- 2172 Chestnut Log Dr
- 2300 Cedar Creek Ct