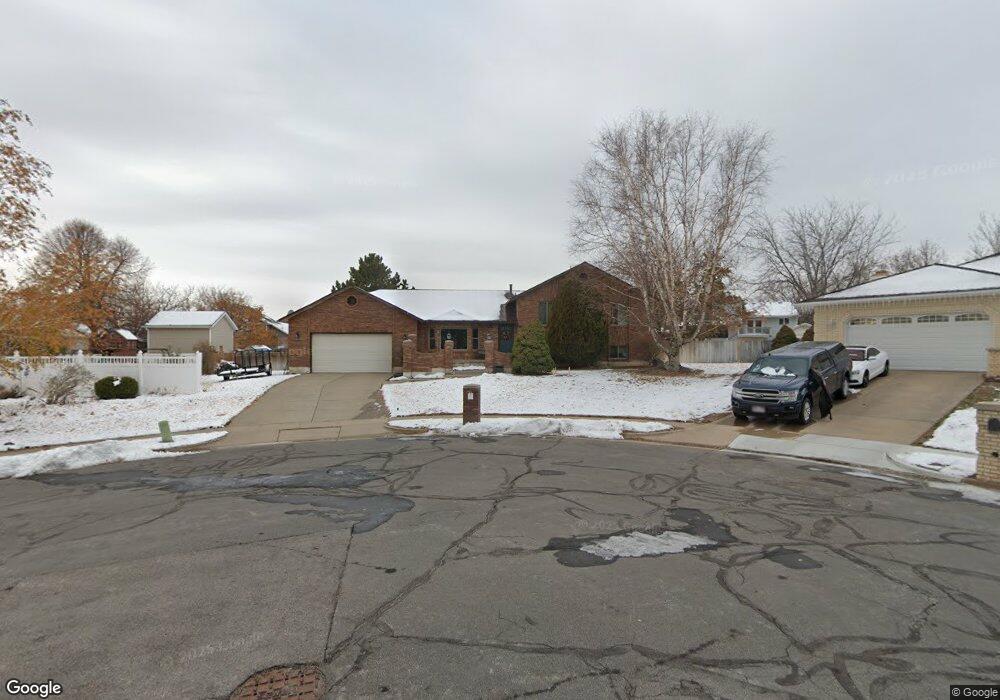
2285 E 2425 N Layton, UT 84040
Estimated Value: $585,000 - $637,119
5
Beds
3
Baths
3,070
Sq Ft
$197/Sq Ft
Est. Value
About This Home
This home is located at 2285 E 2425 N, Layton, UT 84040 and is currently estimated at $605,780, approximately $197 per square foot. 2285 E 2425 N is a home located in Davis County with nearby schools including Sarah Jane Adams Elementary School, North Layton Junior High School, and Northridge High School.
Ownership History
Date
Name
Owned For
Owner Type
Purchase Details
Closed on
Aug 8, 2023
Sold by
Rock River Homes Llc
Bought by
Charles Louis H and Charles Jessica L
Current Estimated Value
Home Financials for this Owner
Home Financials are based on the most recent Mortgage that was taken out on this home.
Original Mortgage
$400,000
Outstanding Balance
$390,316
Interest Rate
6.71%
Mortgage Type
New Conventional
Estimated Equity
$215,465
Purchase Details
Closed on
Feb 27, 2023
Sold by
Christensen Douglas Bruce
Bought by
Rock River Homes Llc
Home Financials for this Owner
Home Financials are based on the most recent Mortgage that was taken out on this home.
Original Mortgage
$416,500
Interest Rate
6.33%
Mortgage Type
New Conventional
Purchase Details
Closed on
Mar 17, 2020
Sold by
Christensen Lorna S
Bought by
Christensen Douglas
Home Financials for this Owner
Home Financials are based on the most recent Mortgage that was taken out on this home.
Original Mortgage
$297,000
Interest Rate
3.5%
Mortgage Type
New Conventional
Create a Home Valuation Report for This Property
The Home Valuation Report is an in-depth analysis detailing your home's value as well as a comparison with similar homes in the area
Home Values in the Area
Average Home Value in this Area
Purchase History
| Date | Buyer | Sale Price | Title Company |
|---|---|---|---|
| Charles Louis H | -- | None Listed On Document | |
| Rock River Homes Llc | -- | Inwest Title | |
| Christensen Douglas | -- | Oasis Title Llc |
Source: Public Records
Mortgage History
| Date | Status | Borrower | Loan Amount |
|---|---|---|---|
| Open | Charles Louis H | $400,000 | |
| Previous Owner | Rock River Homes Llc | $416,500 | |
| Previous Owner | Christensen Douglas | $297,000 |
Source: Public Records
Tax History
| Year | Tax Paid | Tax Assessment Tax Assessment Total Assessment is a certain percentage of the fair market value that is determined by local assessors to be the total taxable value of land and additions on the property. | Land | Improvement |
|---|---|---|---|---|
| 2025 | $3,277 | $321,200 | $136,936 | $184,264 |
| 2024 | $3,124 | $310,200 | $158,463 | $151,737 |
| 2023 | $2,932 | $516,000 | $208,887 | $307,113 |
| 2022 | $3,038 | $292,050 | $112,462 | $179,588 |
| 2021 | $2,707 | $387,000 | $171,823 | $215,177 |
| 2020 | $2,462 | $337,000 | $141,804 | $195,196 |
| 2019 | $2,381 | $321,000 | $126,092 | $194,908 |
| 2018 | $2,207 | $299,000 | $100,265 | $198,735 |
| 2016 | $2,032 | $144,100 | $52,330 | $91,770 |
| 2015 | $2,004 | $135,630 | $52,330 | $83,300 |
| 2014 | $1,882 | $130,723 | $52,330 | $78,393 |
| 2013 | -- | $111,513 | $27,993 | $83,520 |
Source: Public Records
Map
Nearby Homes
- 2597 N 2300 E
- 2340 N 2050 E
- 2273 N 1975 E
- 2563 E 2250 N
- 2353 Canyon View Dr
- 2189 N 1950 E
- 1935 Deere Valley Dr
- 1911 Deere Valley Dr
- 3142 E Thorley Dr
- 3138 E Thorley Dr
- 1907 N Bridge Ct
- 1785 E 2825 N
- 1731 E 2825 N
- 2509 E 1900 N
- 1954 N 2600 E
- 2547 E 1900 N
- 2136 N 2800 E
- 2569 N 2900 E
- 1821 E Whitetail Way
- 2826 N 1600 E
- 2287 E 2425 N
- 2281 E 2425 N
- 2284 E Sunset Dr
- 2282 E Sunset Dr
- 2286 E Sunset Dr
- 2288 E 2425 N
- 2288 E Sunset Dr
- 2282 E 2425 N
- 2280 E Sunset Dr
- 2447 N 2300 E
- 2280 E 2500 N
- 2278 E 2425 N
- 2294 E Sunset Dr
- 2423 N 2300 E
- 2287 E 2400 N
- 2277 E 2400 N
- 2427 N 2275 E
- 2435 N 2275 E
- 2283 E Sunset Dr
- 2285 E Sunset Dr
Your Personal Tour Guide
Ask me questions while you tour the home.