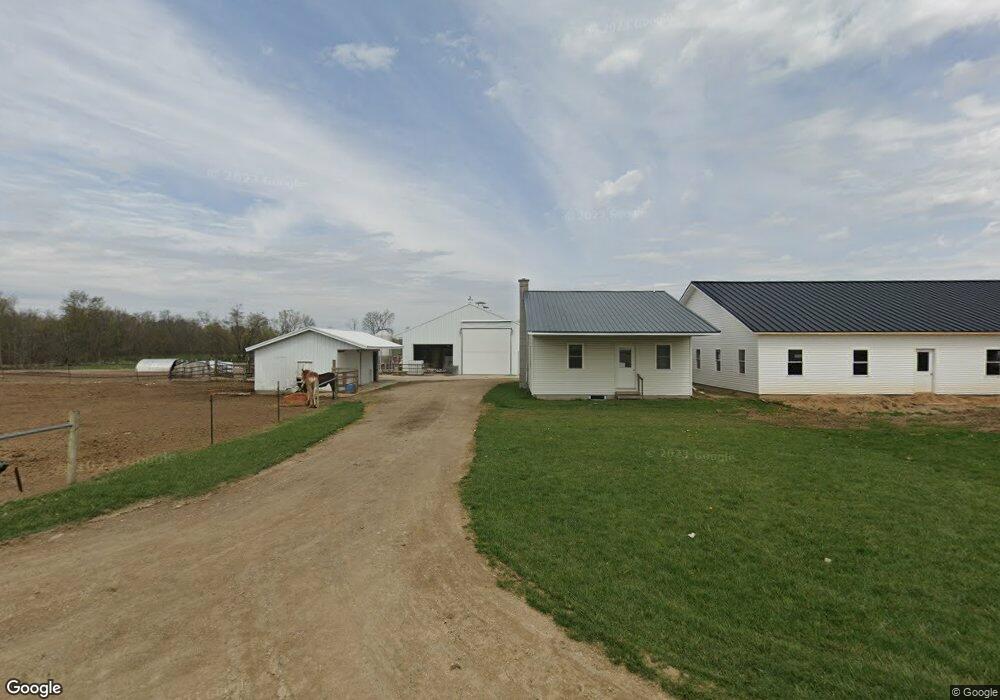
2285 E 300 S Lagrange, IN 46761
Estimated Value: $254,000 - $753,912
3
Beds
1
Bath
1,014
Sq Ft
$497/Sq Ft
Est. Value
About This Home
This home is located at 2285 E 300 S, Lagrange, IN 46761 and is currently estimated at $503,956, approximately $496 per square foot. 2285 E 300 S is a home located in LaGrange County with nearby schools including Lakeland Jr/Sr High School, Oak Hill School, and New Valentine Amish School.
Ownership History
Date
Name
Owned For
Owner Type
Purchase Details
Closed on
Nov 4, 2022
Sold by
Yoder Ernest J and Yoder Ruthetta
Bought by
Yoder Ernest J and Yoder Ruthetta
Current Estimated Value
Home Financials for this Owner
Home Financials are based on the most recent Mortgage that was taken out on this home.
Original Mortgage
$560,000
Outstanding Balance
$528,693
Interest Rate
6.94%
Mortgage Type
New Conventional
Estimated Equity
-$24,737
Purchase Details
Closed on
Feb 26, 2016
Sold by
Milo W Yoder
Bought by
Ruthetta Earnest J and Ruthetta Yoder
Create a Home Valuation Report for This Property
The Home Valuation Report is an in-depth analysis detailing your home's value as well as a comparison with similar homes in the area
Purchase History
| Date | Buyer | Sale Price | Title Company |
|---|---|---|---|
| Yoder Ernest J | -- | None Listed On Document | |
| Ruthetta Earnest J | $160,000 | Jeffrey A James Law Office |
Source: Public Records
Mortgage History
| Date | Status | Borrower | Loan Amount |
|---|---|---|---|
| Open | Yoder Ernest J | $560,000 |
Source: Public Records
Tax History
| Year | Tax Paid | Tax Assessment Tax Assessment Total Assessment is a certain percentage of the fair market value that is determined by local assessors to be the total taxable value of land and additions on the property. | Land | Improvement |
|---|---|---|---|---|
| 2025 | $4,207 | $699,000 | $156,300 | $542,700 |
| 2024 | $4,207 | $691,100 | $163,700 | $527,400 |
| 2023 | $3,924 | $549,500 | $140,800 | $408,700 |
| 2022 | $3,573 | $471,900 | $115,500 | $356,400 |
| 2021 | $2,913 | $401,700 | $101,700 | $300,000 |
| 2020 | $3,083 | $384,400 | $98,400 | $286,000 |
| 2019 | $3,309 | $397,000 | $111,200 | $285,800 |
| 2018 | $3,532 | $400,100 | $113,500 | $286,600 |
| 2017 | $2,674 | $334,700 | $124,400 | $210,300 |
| 2016 | $1,402 | $200,200 | $111,000 | $89,200 |
| 2014 | $1,489 | $205,700 | $123,500 | $82,200 |
| 2013 | $1,489 | $188,100 | $109,400 | $78,700 |
Source: Public Records
Map
Nearby Homes
Your Personal Tour Guide
Ask me questions while you tour the home.