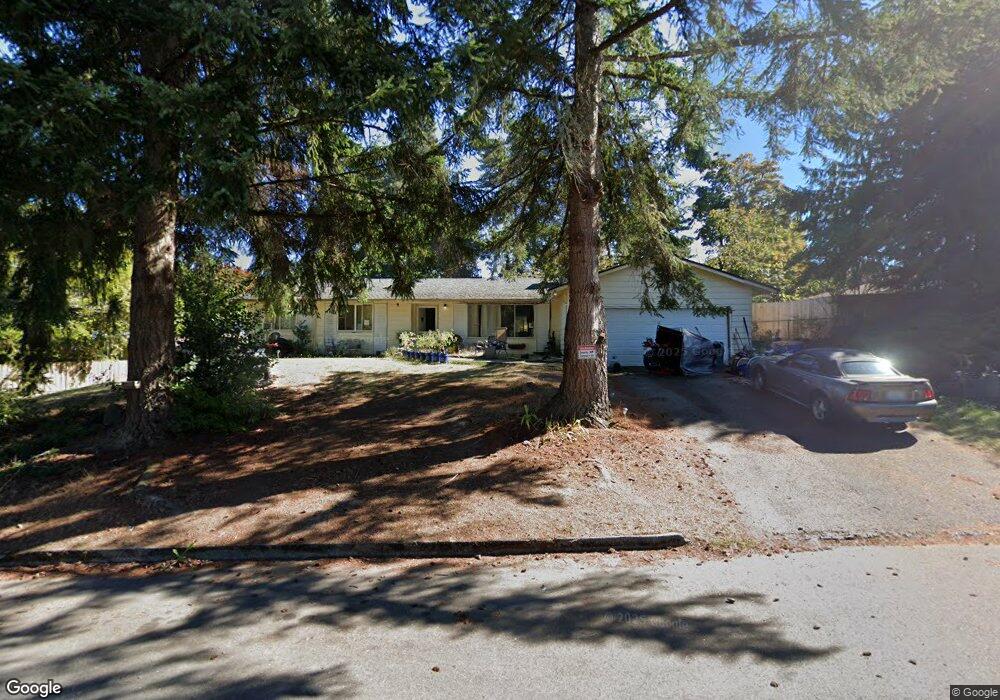
2285 Evergreen Ave SE Port Orchard, WA 98366
East Port Orchard NeighborhoodEstimated Value: $414,000 - $455,000
3
Beds
2
Baths
1,345
Sq Ft
$326/Sq Ft
Est. Value
About This Home
This home is located at 2285 Evergreen Ave SE, Port Orchard, WA 98366 and is currently estimated at $439,083, approximately $326 per square foot. 2285 Evergreen Ave SE is a home located in Kitsap County with nearby schools including East Port Orchard Elementary School, Marcus Whitman Middle School, and South Kitsap High School.
Ownership History
Date
Name
Owned For
Owner Type
Purchase Details
Closed on
Jun 10, 2021
Sold by
Chase Riley A and Feflerplace Jennifer L
Bought by
Chase Properties Llc
Current Estimated Value
Purchase Details
Closed on
Apr 15, 2021
Sold by
Chase Riley A and Fetterplace Chase Jennifer
Bought by
Chase Riley A and Fetterplace Jennifer L
Purchase Details
Closed on
Mar 10, 2021
Sold by
Chase Properties Llc
Bought by
Chase Riley A and Fetterplace Chase Jennifer
Purchase Details
Closed on
Dec 13, 2017
Sold by
Chase Riley A and Fetterplace Jennifer L
Bought by
Chase Properties Llc
Purchase Details
Closed on
Jan 3, 2017
Sold by
2285 Evergreen Llc
Bought by
Chase Riley A and Fetterplace Jennifer L
Purchase Details
Closed on
Apr 15, 2013
Sold by
Fetterplace Jennifer and Chase Riley A
Bought by
2285 Evergreen Llc
Purchase Details
Closed on
Oct 22, 2012
Sold by
Fetterplace Gary
Bought by
Fetterplace Jennifer
Purchase Details
Closed on
May 29, 2002
Sold by
Mccahon Wallace L and Mccahon Barbara A
Bought by
Clevenger Jennifer L
Home Financials for this Owner
Home Financials are based on the most recent Mortgage that was taken out on this home.
Original Mortgage
$101,246
Interest Rate
6.89%
Mortgage Type
FHA
Create a Home Valuation Report for This Property
The Home Valuation Report is an in-depth analysis detailing your home's value as well as a comparison with similar homes in the area
Home Values in the Area
Average Home Value in this Area
Purchase History
| Date | Buyer | Sale Price | Title Company |
|---|---|---|---|
| Chase Properties Llc | -- | None Available | |
| Chase Riley A | -- | None Available | |
| Chase Riley A | -- | None Available | |
| Chase Properties Llc | -- | -- | |
| Chase Riley A | -- | None Available | |
| 2285 Evergreen Llc | -- | None Available | |
| Fetterplace Jennifer | -- | None Available | |
| Clevenger Jennifer L | $105,000 | Transnation Title Insurance |
Source: Public Records
Mortgage History
| Date | Status | Borrower | Loan Amount |
|---|---|---|---|
| Previous Owner | Clevenger Jennifer L | $101,246 |
Source: Public Records
Tax History Compared to Growth
Tax History
| Year | Tax Paid | Tax Assessment Tax Assessment Total Assessment is a certain percentage of the fair market value that is determined by local assessors to be the total taxable value of land and additions on the property. | Land | Improvement |
|---|---|---|---|---|
| 2026 | $3,282 | $399,540 | $74,130 | $325,410 |
| 2025 | $3,282 | $370,510 | $62,970 | $307,540 |
| 2024 | $3,183 | $370,510 | $62,970 | $307,540 |
| 2023 | $3,162 | $370,510 | $62,970 | $307,540 |
| 2022 | $3,107 | $305,130 | $58,810 | $246,320 |
| 2021 | $2,955 | $274,580 | $54,640 | $219,940 |
| 2020 | $2,904 | $262,230 | $52,040 | $210,190 |
| 2019 | $2,425 | $239,540 | $51,100 | $188,440 |
| 2018 | $2,540 | $195,140 | $51,100 | $144,040 |
| 2017 | $2,177 | $195,140 | $51,100 | $144,040 |
| 2016 | $2,128 | $174,560 | $51,100 | $123,460 |
| 2015 | $2,061 | $171,310 | $51,100 | $120,210 |
| 2014 | -- | $168,060 | $51,100 | $116,960 |
| 2013 | -- | $164,880 | $53,790 | $111,090 |
Source: Public Records
Map
Nearby Homes
- 0 Lincoln Ave SE
- 2313 Lincoln Ave SE
- 2235 Eisenhower Ave SE
- 3132 Harris Rd SE
- 1350 SE Shelton Ln
- 2673 Harold Dr SE
- 4990 Mile Hill Dr
- 2124 Pine Tree Dr SE
- 2949 SE Mile Hill Dr Unit C7
- 2949 SE Mile Hill Dr Unit C-2
- 2116 Pine Tree Dr SE
- 2198 SE Galeel Ct
- 2360 SE Plymouth Way
- 2017 SE Juniper Ct
- 2315 SE Kelby Cir
- 2475 Parkwood Dr SE
- 2225 SE Kelby Cir
- 2808 Pine Cone Ct SE
- 2457 White Cedar Dr SE
- 0 Wendell Ave SE
- 2261 Evergreen Ave SE
- 2286 Lincoln Ave SE
- 2262 Lincoln Ave SE
- 2349 Evergreen Ave SE
- 2237 Evergreen Ave SE
- 2238 Lincoln Ave SE
- 2312 Evergreen Ave SE
- 2234 Evergreen Ave SE
- 2342 Evergreen Ave SE
- 2332 Evergreen Ave SE
- 2213 Evergreen Ave SE
- 2322 Evergreen Ave SE
- 2352 Evergreen Ave SE
- 2214 Lincoln Ave SE
- 2210 Evergreen Ave SE
- 2283 Lincoln Ave SE
- 2275 Lincoln Ave SE
- 2287 Lincoln Ave SE
- 2353 Lincoln Ave SE