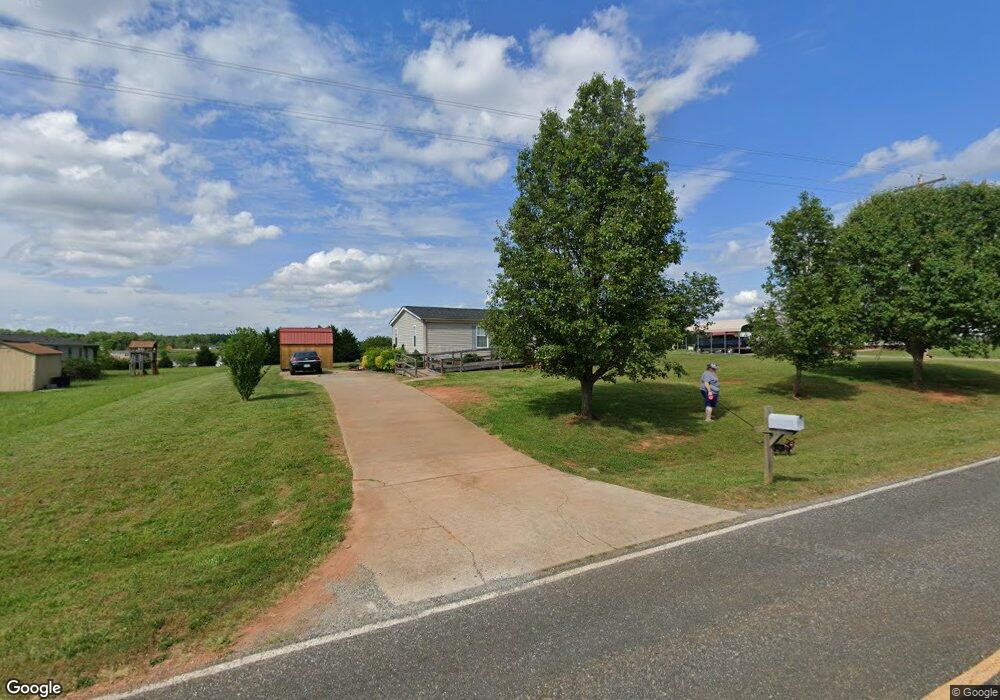
2285 Leonards Fork Church Rd Crouse, NC 28033
Estimated Value: $194,000 - $212,000
3
Beds
2
Baths
1,574
Sq Ft
$130/Sq Ft
Est. Value
About This Home
This home is located at 2285 Leonards Fork Church Rd, Crouse, NC 28033 and is currently estimated at $205,333, approximately $130 per square foot. 2285 Leonards Fork Church Rd is a home located in Lincoln County with nearby schools including Norris S. Childers Elementary School, West Lincoln Middle, and West Lincoln High School.
Ownership History
Date
Name
Owned For
Owner Type
Purchase Details
Closed on
Jul 21, 2016
Sold by
Huffman Madgalene Hallman
Bought by
Turner Jewell M and Turner Cindy R
Current Estimated Value
Home Financials for this Owner
Home Financials are based on the most recent Mortgage that was taken out on this home.
Original Mortgage
$85,500
Outstanding Balance
$48,481
Interest Rate
3.54%
Estimated Equity
$156,852
Purchase Details
Closed on
Feb 24, 2010
Sold by
Secretary Of Housing & Urban Development
Bought by
Huffman Madgalene H
Purchase Details
Closed on
Jul 7, 2009
Sold by
Soto Jose Francisco Brenes and Rodriguez Ana I
Bought by
Wells Fargo Bank Na
Purchase Details
Closed on
Jun 19, 2002
Bought by
Soto Jose Francisco Brenes and Soto Jose
Purchase Details
Closed on
May 2, 2002
Bought by
Dri Enterprises Inc
Create a Home Valuation Report for This Property
The Home Valuation Report is an in-depth analysis detailing your home's value as well as a comparison with similar homes in the area
Purchase History
| Date | Buyer | Sale Price | Title Company |
|---|---|---|---|
| Turner Jewell M | $85,500 | None Available | |
| Huffman Madgalene H | -- | None Available | |
| Wells Fargo Bank Na | $105,529 | None Available | |
| Secretary Of Housing & Urban Development | -- | None Available | |
| Soto Jose Francisco Brenes | $113,000 | -- | |
| Dri Enterprises Inc | $14,500 | -- |
Source: Public Records
Mortgage History
| Date | Status | Borrower | Loan Amount |
|---|---|---|---|
| Open | Turner Jewell M | $85,500 |
Source: Public Records
Tax History
| Year | Tax Paid | Tax Assessment Tax Assessment Total Assessment is a certain percentage of the fair market value that is determined by local assessors to be the total taxable value of land and additions on the property. | Land | Improvement |
|---|---|---|---|---|
| 2025 | $879 | $120,374 | $23,830 | $96,544 |
| 2024 | $859 | $120,374 | $23,830 | $96,544 |
| 2023 | $819 | $120,374 | $23,830 | $96,544 |
| 2022 | $674 | $79,261 | $19,862 | $59,399 |
| 2021 | $674 | $79,261 | $19,862 | $59,399 |
| 2020 | $543 | $79,261 | $19,862 | $59,399 |
| 2019 | $543 | $79,261 | $19,862 | $59,399 |
| 2018 | $595 | $70,878 | $17,182 | $53,696 |
| 2017 | $478 | $70,878 | $17,182 | $53,696 |
| 2016 | $478 | $70,878 | $17,182 | $53,696 |
| 2015 | $555 | $70,878 | $17,182 | $53,696 |
| 2014 | $683 | $91,087 | $22,049 | $69,038 |
Source: Public Records
Map
Nearby Homes
- 000 Leonards Fork Church Rd
- 1882 George Brown Rd Unit 4
- 3316 Evondale Rd
- 1357 Malden Ct
- 3103 Richview Dr
- 2501 Swanson Rd
- 1586 Pleasant Grove Church Rd
- 1568 Pleasant Grove Church Rd
- 1074 Lyndsey Brook Ct
- 1000 Creekside Dr
- 00 Arrow St Unit 38
- 00 N Carolina Highway 150
- 1266 Old Lincolnton Crouse Rd
- 845 Meadow Hill Ct
- 4660 Garys Place
- 0000 Garys Place
- 7124 Old Hickory Ln
- 3051 Shoal Rd
- 792 Mace Ln
- 1778 Highway 182
- 2297 Leonards Fork Church Rd
- 1923 Cullendale Ct
- 2307 Leonards Fork Church Rd
- 1889 Cullendale Ct
- 1914 Cullendale Ct
- 1698 George Brown Rd
- 1758 George Brown Rd
- 2239 Leonards Fork Church Rd
- 2239 Leonards Fork Church Rd Unit 11
- 1774 George Brown Rd
- 1887 Cullendale Ct
- 1717 George Brown Rd
- 1735 George Brown Rd
- 1688 George Brown Rd
- 2229 Leonards Fork Church Rd
- 1888 Cullendale Ct
- 1771 George Brown Rd
- 1886 Cullendale Ct
- 1678 George Brown Rd
- 3493 Dave Heafner Rd
Your Personal Tour Guide
Ask me questions while you tour the home.