Estimated Value: $400,000 - $440,000
4
Beds
2
Baths
1,960
Sq Ft
$214/Sq Ft
Est. Value
About This Home
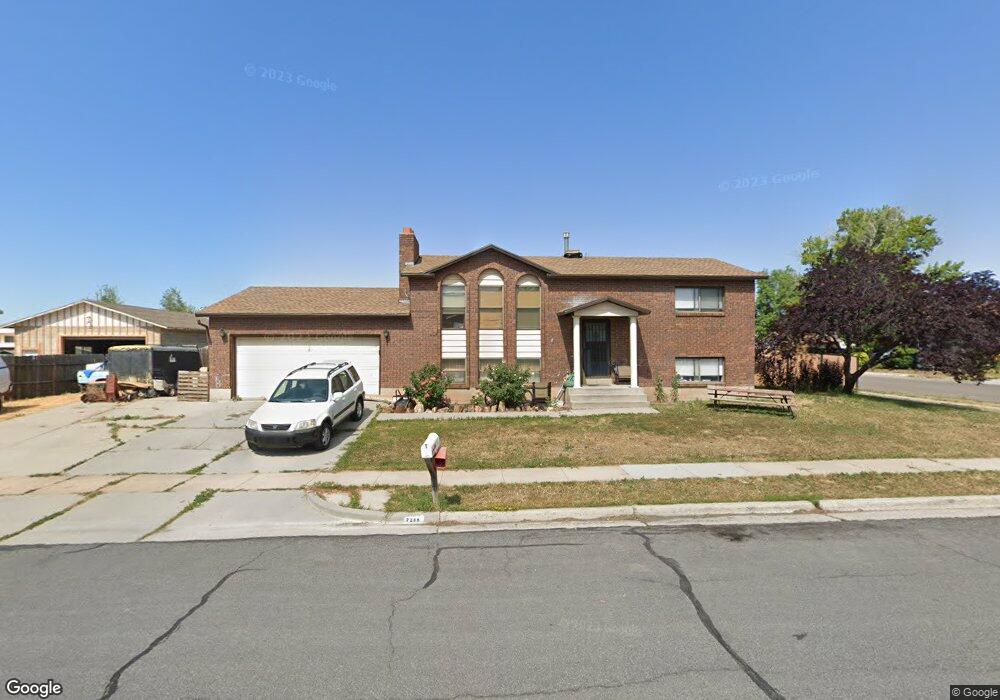
This home is located at 2285 N 700 W, Ogden, UT 84414 and is currently estimated at $419,048, approximately $213 per square foot. 2285 N 700 W is a home located in Weber County with nearby schools including Majestic Elementary School, Orion Junior High School, and Weber High School.
Ownership History
Date
Name
Owned For
Owner Type
Purchase Details
Closed on
Dec 7, 2021
Sold by
Higgs Douglas
Bought by
Higgs Douglas and Higgs Kearsten
Current Estimated Value
Home Financials for this Owner
Home Financials are based on the most recent Mortgage that was taken out on this home.
Original Mortgage
$89,190
Outstanding Balance
$69,769
Interest Rate
2.37%
Mortgage Type
New Conventional
Estimated Equity
$349,279
Purchase Details
Closed on
Apr 19, 2002
Sold by
Andrews Ryan W and Andrews Kimberly D
Bought by
Higgs Douglas
Purchase Details
Closed on
Aug 7, 2000
Sold by
Sappington Jeffrey Allen
Bought by
Andrews Ryan W and Andrews Kimberly D
Home Financials for this Owner
Home Financials are based on the most recent Mortgage that was taken out on this home.
Original Mortgage
$118,919
Interest Rate
8.12%
Mortgage Type
FHA
Create a Home Valuation Report for This Property
The Home Valuation Report is an in-depth analysis detailing your home's value as well as a comparison with similar homes in the area
Home Values in the Area
Average Home Value in this Area
Purchase History
| Date | Buyer | Sale Price | Title Company |
|---|---|---|---|
| Higgs Douglas | -- | None Listed On Document | |
| Higgs Douglas | -- | Mortgage Connect Lp Vendor I | |
| Higgs Douglas | -- | Superior Title Company | |
| Andrews Ryan W | -- | Associated Title |
Source: Public Records
Mortgage History
| Date | Status | Borrower | Loan Amount |
|---|---|---|---|
| Open | Higgs Douglas | $89,190 | |
| Closed | Higgs Douglas | $89,190 | |
| Previous Owner | Andrews Ryan W | $118,919 |
Source: Public Records
Tax History Compared to Growth
Tax History
| Year | Tax Paid | Tax Assessment Tax Assessment Total Assessment is a certain percentage of the fair market value that is determined by local assessors to be the total taxable value of land and additions on the property. | Land | Improvement |
|---|---|---|---|---|
| 2025 | $2,838 | $412,093 | $121,272 | $290,821 |
| 2024 | $2,838 | $222,749 | $66,699 | $156,050 |
| 2023 | $2,567 | $202,400 | $66,501 | $135,899 |
| 2022 | $2,543 | $205,700 | $63,661 | $142,039 |
| 2021 | $1,907 | $277,000 | $65,868 | $211,132 |
| 2020 | $1,720 | $229,000 | $50,561 | $178,439 |
| 2019 | $1,712 | $216,000 | $45,502 | $170,498 |
| 2018 | $1,660 | $200,000 | $43,541 | $156,459 |
| 2017 | $1,445 | $161,000 | $38,502 | $122,498 |
| 2016 | $1,455 | $88,289 | $19,262 | $69,027 |
| 2015 | $1,254 | $73,751 | $19,262 | $54,489 |
| 2014 | $1,332 | $77,887 | $19,262 | $58,625 |
Source: Public Records
Map
Nearby Homes
- 729 W 2300 N
- 795 Willow Brook Ln
- 2011 N 600 W
- 1278 N 375 W Unit 152
- 2540 N 450 W
- 2491 U S 89 Unit 437
- 1260 N 350 W Unit 160
- 1272 N 350 W Unit 158
- 1266 N 350 W Unit 159
- 2491 N Highway 89 Unit 434
- 2491 N Highway 89 Unit 125
- 2491 N Highway 89 Unit 523
- 2491 N Highway 89 Unit 111
- 2491 N Highway 89 Unit 302
- 2491 N Highway 89 Unit 435
- 2491 N Highway 89 Unit 323
- 759 W Fox Meadow Dr
- 615 Fox Meadow Dr
- 2717 N 825 W Unit 28
- 747 W 2775 N