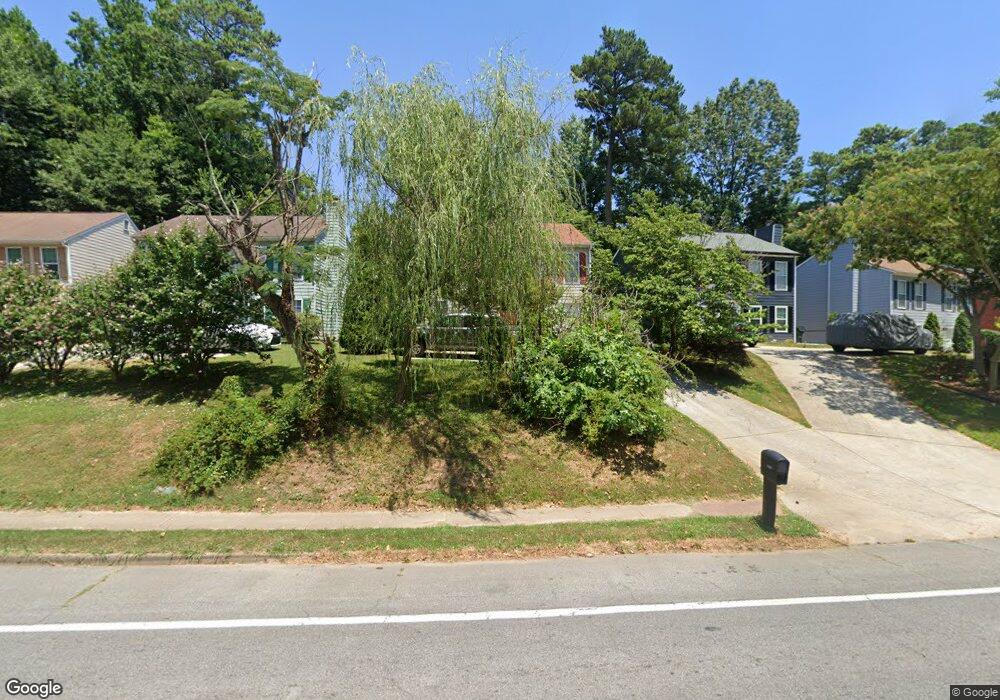
2286 Mitchell Rd Norcross, GA 30071
Estimated Value: $279,000 - $358,000
3
Beds
2
Baths
1,368
Sq Ft
$226/Sq Ft
Est. Value
About This Home
This home is located at 2286 Mitchell Rd, Norcross, GA 30071 and is currently estimated at $309,798, approximately $226 per square foot. 2286 Mitchell Rd is a home located in Gwinnett County with nearby schools including Baldwin Elementary, Summerour Middle School, and Paul Duke STEM High School.
Ownership History
Date
Name
Owned For
Owner Type
Purchase Details
Closed on
Sep 5, 2002
Sold by
Luna Jose M
Bought by
Luna Jose M
Current Estimated Value
Home Financials for this Owner
Home Financials are based on the most recent Mortgage that was taken out on this home.
Original Mortgage
$89,157
Outstanding Balance
$36,694
Interest Rate
6.3%
Mortgage Type
New Conventional
Estimated Equity
$273,104
Purchase Details
Closed on
Jan 4, 1999
Sold by
Nkamanyi Richard L
Bought by
Lung Jose Martinez
Home Financials for this Owner
Home Financials are based on the most recent Mortgage that was taken out on this home.
Original Mortgage
$85,956
Interest Rate
6.71%
Mortgage Type
FHA
Purchase Details
Closed on
Oct 1, 1993
Sold by
Sunset Prop Inc
Bought by
Nkamanyi Richard L
Home Financials for this Owner
Home Financials are based on the most recent Mortgage that was taken out on this home.
Original Mortgage
$62,546
Interest Rate
7.01%
Create a Home Valuation Report for This Property
The Home Valuation Report is an in-depth analysis detailing your home's value as well as a comparison with similar homes in the area
Home Values in the Area
Average Home Value in this Area
Purchase History
| Date | Buyer | Sale Price | Title Company |
|---|---|---|---|
| Luna Jose M | -- | -- | |
| Lung Jose Martinez | $86,000 | -- | |
| Nkamanyi Richard L | $68,000 | -- |
Source: Public Records
Mortgage History
| Date | Status | Borrower | Loan Amount |
|---|---|---|---|
| Open | Luna Jose M | $89,157 | |
| Previous Owner | Lung Jose Martinez | $85,956 | |
| Previous Owner | Nkamanyi Richard L | $62,546 |
Source: Public Records
Tax History Compared to Growth
Tax History
| Year | Tax Paid | Tax Assessment Tax Assessment Total Assessment is a certain percentage of the fair market value that is determined by local assessors to be the total taxable value of land and additions on the property. | Land | Improvement |
|---|---|---|---|---|
| 2025 | $2,632 | $129,200 | $31,920 | $97,280 |
| 2024 | $2,350 | $109,400 | $22,400 | $87,000 |
| 2023 | $2,350 | $109,400 | $22,400 | $87,000 |
| 2022 | $2,121 | $97,800 | $22,400 | $75,400 |
| 2021 | $1,459 | $63,680 | $13,600 | $50,080 |
| 2020 | $1,475 | $63,680 | $13,600 | $50,080 |
| 2019 | $1,708 | $51,000 | $10,800 | $40,200 |
| 2018 | $1,206 | $51,000 | $10,800 | $40,200 |
| 2016 | $976 | $40,200 | $8,000 | $32,200 |
| 2015 | $1,107 | $31,000 | $6,000 | $25,000 |
| 2014 | -- | $31,000 | $6,000 | $25,000 |
Source: Public Records
Map
Nearby Homes
- 2199 Summertown Dr
- 5479 Windy Creek Ln
- 5477 Windy Creek Ln
- 2848 Wild Laurel Ct
- 2375 Beaver Falls Dr
- 5639 Chatham Cir
- 5364 Hickory Knoll
- 5358 Beaver Branch
- 5357 Beaver Branch
- 5645 Hammond Dr
- 5457 Rails Way
- 5341 Goodwick Way
- 5381 Station Cir Unit 3
- 608 Summer Place
- 5766 Buford Hwy
- 5596 Buford Hwy
- 622 Summer Place
- 2340 Beaver Ruin Rd Unit 26
- 2340 Beaver Ruin Rd Unit 41
- 2340 Beaver Ruin Rd
- 2282 Mitchell Rd
- 2290 Mitchell Rd
- 0 Mitchell Rd NW
- 2278 Mitchell Rd
- 2294 Mitchell Rd
- 2274 Mitchell Rd
- 2306 Landings Ct
- 2270 Mitchell Rd
- 2296 Landings Ct
- 5656 Executive Way Unit 1
- 2316 Landings Ct
- 5654 Executive Way
- 2286 Landings Ct
- 5652 Executive Way
- 5652 Executive Way
- 5652 Executive Way Unit 5652
- 5650 Executive Way Unit 1
- 5648 Executive Way
- 2276 Landings Ct
- 2326 Landings Ct