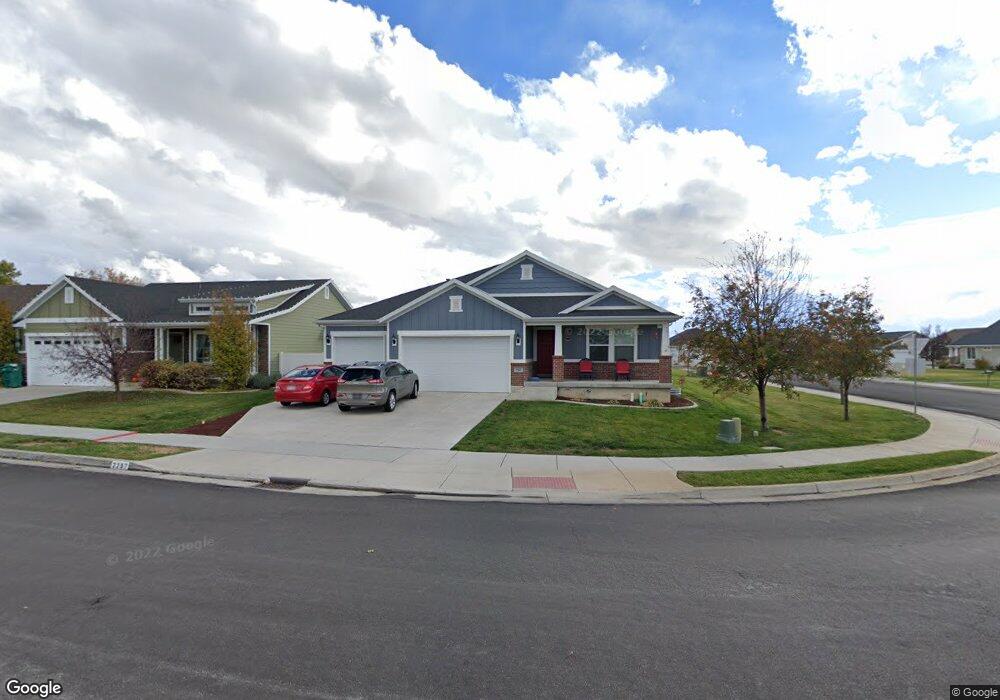
2287 Field Stone Way Layton, UT 84041
Estimated Value: $697,936 - $745,000
5
Beds
3
Baths
3,986
Sq Ft
$180/Sq Ft
Est. Value
About This Home
This home is located at 2287 Field Stone Way, Layton, UT 84041 and is currently estimated at $717,734, approximately $180 per square foot. 2287 Field Stone Way is a home located in Davis County with nearby schools including Shoreline Junior High School, Layton High School, and North Davis Preparatory Academy.
Ownership History
Date
Name
Owned For
Owner Type
Purchase Details
Closed on
Jul 15, 2019
Sold by
Hpa Us1 Llc
Bought by
Hpa Ii Borrower 2019 1 Llc
Current Estimated Value
Home Financials for this Owner
Home Financials are based on the most recent Mortgage that was taken out on this home.
Original Mortgage
$292,423,143
Outstanding Balance
$255,156,048
Interest Rate
3.73%
Mortgage Type
Commercial
Estimated Equity
-$254,438,314
Purchase Details
Closed on
Feb 13, 2019
Sold by
Newbold Blake and Newbold Haylee
Bought by
Hpa Us1 Llc
Purchase Details
Closed on
Jan 6, 2017
Sold by
Allred Amy L
Bought by
Newbold Blake and Newbold Haylee
Home Financials for this Owner
Home Financials are based on the most recent Mortgage that was taken out on this home.
Original Mortgage
$373,350
Interest Rate
4.13%
Mortgage Type
New Conventional
Purchase Details
Closed on
Jan 28, 2014
Sold by
Terraventure Development Ltd
Bought by
Nilson And Company Inc and Nilson Homes
Create a Home Valuation Report for This Property
The Home Valuation Report is an in-depth analysis detailing your home's value as well as a comparison with similar homes in the area
Home Values in the Area
Average Home Value in this Area
Purchase History
| Date | Buyer | Sale Price | Title Company |
|---|---|---|---|
| Hpa Ii Borrower 2019 1 Llc | -- | Stewart Title Ins Age | |
| Hpa Us1 Llc | -- | Stewart Title Ins Agency | |
| Newbold Blake | -- | -- | |
| Newbold Blake | -- | -- | |
| Nilson And Company Inc | -- | Backman Title Servic |
Source: Public Records
Mortgage History
| Date | Status | Borrower | Loan Amount |
|---|---|---|---|
| Open | Hpa Ii Borrower 2019 1 Llc | $292,423,143 | |
| Previous Owner | Newbold Blake | $373,350 |
Source: Public Records
Tax History Compared to Growth
Tax History
| Year | Tax Paid | Tax Assessment Tax Assessment Total Assessment is a certain percentage of the fair market value that is determined by local assessors to be the total taxable value of land and additions on the property. | Land | Improvement |
|---|---|---|---|---|
| 2025 | $3,458 | $363,000 | $98,416 | $264,584 |
| 2024 | $3,475 | $367,399 | $111,334 | $256,065 |
| 2023 | $3,455 | $354,200 | $57,904 | $296,295 |
| 2022 | $3,641 | $670,000 | $125,713 | $544,287 |
| 2021 | $3,306 | $499,000 | $103,763 | $395,237 |
| 2020 | $2,997 | $434,000 | $86,345 | $347,655 |
| 2019 | $3,137 | $445,000 | $91,178 | $353,822 |
| 2018 | $2,851 | $406,000 | $79,678 | $326,322 |
| 2016 | $2,317 | $170,170 | $33,003 | $137,167 |
| 2015 | $860 | $60,006 | $60,006 | $0 |
| 2014 | $765 | $54,551 | $54,551 | $0 |
| 2013 | -- | $55,247 | $55,247 | $0 |
Source: Public Records
Map
Nearby Homes
- 2182 W Evergreen Way Unit 143
- 306 S Sunburst Dr
- 583 S Alberta Spruce Dr
- 2184 W Gentile St
- 1919 W 850 S
- 2875 N Hill Rd Unit 199
- 2875 N Hill Rd Unit 27
- 920 S 1700 W Unit 1
- 37 N Swift Creek Dr
- 2794 W Gentile St
- 796 S Rock Creek Corner
- 1124 S Neville St
- 163 Cold Creek Way
- 1234 S Grace Way
- 306 Swift Creek Dr
- 1278 S Grace Way
- 1606 W 200 N
- 1764 W Swift Creek Dr
- Browning Plan at Amber Fields
- Rhapsody Plan at Amber Fields
- 2271 Field Stone Way
- 2282 W 525 S Unit 304
- 2259 Field Stone Way
- 2268 W 525 S
- 2270 Field Stone Way
- 2247 Field Stone Way
- 2286 Field Stone Way
- 2258 Field Stone Way
- 2323 Field Stone Way
- 2259 W 525 S Unit 306
- 2235 Field Stone Way Unit 103
- 2235 Field Stone Way
- 2320 W 525 S
- 2246 Field Stone Way Unit 111
- 2335 Field Stone Way
- 2322 Field Stone Way
- 437 S 2300 W
- 2289 W 525 S Unit 309
- 2330 W 525 S Unit 302
- 2275 W 525 S Unit 308