Estimated Value: $445,000 - $471,000
4
Beds
3
Baths
2,532
Sq Ft
$179/Sq Ft
Est. Value
About This Home
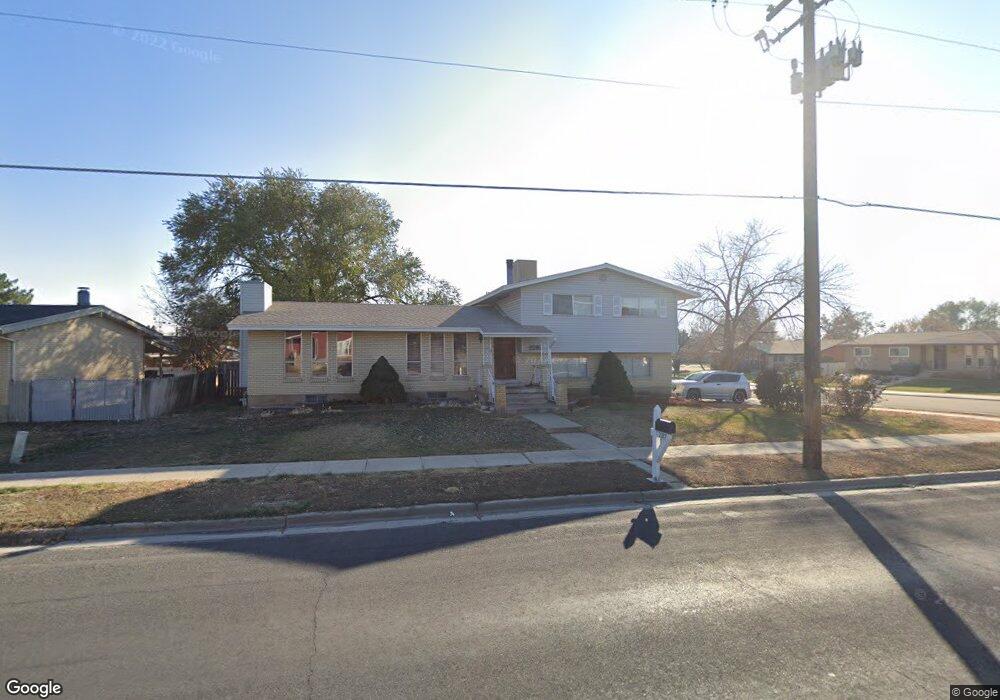
This home is located at 2287 W 4400 S, Roy, UT 84067 and is currently estimated at $453,267, approximately $179 per square foot. 2287 W 4400 S is a home located in Weber County with nearby schools including Valley View School, Sand Ridge Junior High School, and Roy High School.
Ownership History
Date
Name
Owned For
Owner Type
Purchase Details
Closed on
Dec 19, 2018
Sold by
Anderson Walter J
Bought by
King Derek and King Terrilynn
Current Estimated Value
Home Financials for this Owner
Home Financials are based on the most recent Mortgage that was taken out on this home.
Original Mortgage
$14,445
Outstanding Balance
$12,752
Interest Rate
4.9%
Mortgage Type
FHA
Estimated Equity
$440,515
Purchase Details
Closed on
Feb 9, 2010
Sold by
Anderson Walter J and Anderson Beverly R
Bought by
Anderson Walter J
Home Financials for this Owner
Home Financials are based on the most recent Mortgage that was taken out on this home.
Original Mortgage
$160,375
Interest Rate
5.11%
Mortgage Type
VA
Create a Home Valuation Report for This Property
The Home Valuation Report is an in-depth analysis detailing your home's value as well as a comparison with similar homes in the area
Home Values in the Area
Average Home Value in this Area
Purchase History
| Date | Buyer | Sale Price | Title Company |
|---|---|---|---|
| King Derek | -- | Us Title Insurance Agency | |
| Anderson Walter J | -- | Inwest Title Ogden |
Source: Public Records
Mortgage History
| Date | Status | Borrower | Loan Amount |
|---|---|---|---|
| Open | King Derek | $14,445 | |
| Previous Owner | Anderson Walter J | $160,375 |
Source: Public Records
Tax History
| Year | Tax Paid | Tax Assessment Tax Assessment Total Assessment is a certain percentage of the fair market value that is determined by local assessors to be the total taxable value of land and additions on the property. | Land | Improvement |
|---|---|---|---|---|
| 2025 | $2,727 | $434,296 | $135,155 | $299,141 |
| 2024 | $2,662 | $234,849 | $74,335 | $160,514 |
| 2023 | $2,711 | $240,900 | $74,847 | $166,053 |
| 2022 | $2,572 | $233,750 | $52,340 | $181,410 |
| 2021 | $2,264 | $340,000 | $63,306 | $276,694 |
| 2020 | $2,059 | $283,000 | $63,306 | $219,694 |
| 2019 | $1,974 | $255,000 | $36,249 | $218,751 |
| 2018 | $1,810 | $219,000 | $33,454 | $185,546 |
| 2017 | $1,436 | $205,000 | $33,454 | $171,546 |
| 2016 | $1,248 | $98,123 | $16,253 | $81,870 |
| 2015 | $1,109 | $90,551 | $16,253 | $74,298 |
| 2014 | $1,103 | $89,164 | $16,253 | $72,911 |
Source: Public Records
Map
Nearby Homes
- 4328 S 2175 W
- 4248 S 2400 W
- 2015 W 4450 S
- 4220 S 2075 W
- 2015 W 4225 S
- 2038 W 4600 S
- 4061 S 2175 W
- 4047 S 2175 W
- 4642 S 1900 W Unit 41
- 4297 Westlake Dr
- 4881 S 2400 W
- 1959 3985 St S Unit 2
- 4602 Hathaway Dr
- 4598 S Blossom Glen Way
- 3923 S 1975 W Unit 15
- 2815 W 4275 S
- 2240 W 3875 S
- 4732 S West Park Dr
- 2778 W 4175 S Unit 237
- 1940 W 3920 S
Your Personal Tour Guide
Ask me questions while you tour the home.