Estimated Value: $363,222 - $424,000
4
Beds
2
Baths
1,560
Sq Ft
$247/Sq Ft
Est. Value
About This Home
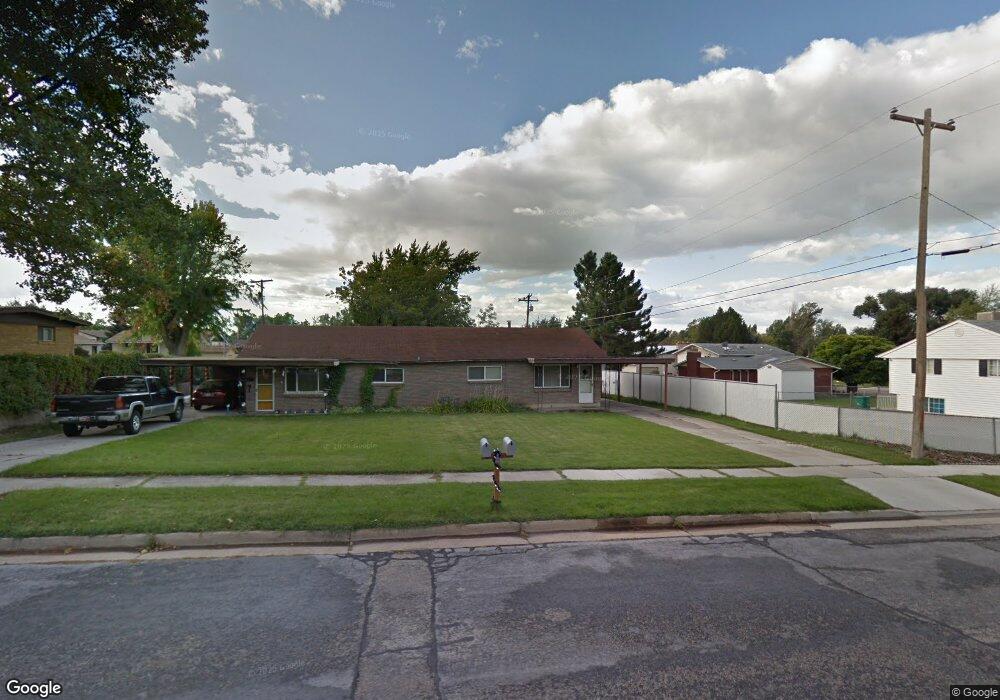
This home is located at 2287 W 5900 S, Roy, UT 84067 and is currently estimated at $385,556, approximately $247 per square foot. 2287 W 5900 S is a home with nearby schools including Municipal School, Roy Junior High School, and Roy High School.
Ownership History
Date
Name
Owned For
Owner Type
Purchase Details
Closed on
Jul 20, 2023
Sold by
Tamara R Mccowen Family Trust
Bought by
Tamara P Mccowen Family Trust and Mccowen
Current Estimated Value
Purchase Details
Closed on
Mar 10, 2023
Sold by
Mccowen Tami
Bought by
Tamara R Mccowen Family Trust
Purchase Details
Closed on
Oct 11, 1996
Sold by
Mccowen Tamara P
Bought by
Mccowen Tom J and Mccowen Tami
Home Financials for this Owner
Home Financials are based on the most recent Mortgage that was taken out on this home.
Original Mortgage
$73,500
Interest Rate
8.37%
Create a Home Valuation Report for This Property
The Home Valuation Report is an in-depth analysis detailing your home's value as well as a comparison with similar homes in the area
Home Values in the Area
Average Home Value in this Area
Purchase History
| Date | Buyer | Sale Price | Title Company |
|---|---|---|---|
| Tamara P Mccowen Family Trust | -- | None Listed On Document | |
| Tamara R Mccowen Family Trust | -- | None Listed On Document | |
| Mccowen Tom J | -- | Mountain View Title |
Source: Public Records
Mortgage History
| Date | Status | Borrower | Loan Amount |
|---|---|---|---|
| Previous Owner | Mccowen Tom J | $73,500 |
Source: Public Records
Tax History
| Year | Tax Paid | Tax Assessment Tax Assessment Total Assessment is a certain percentage of the fair market value that is determined by local assessors to be the total taxable value of land and additions on the property. | Land | Improvement |
|---|---|---|---|---|
| 2025 | $2,147 | $329,600 | $100,000 | $229,600 |
| 2024 | $2,096 | $324,000 | $100,000 | $224,000 |
| 2023 | $2,426 | $385,000 | $74,000 | $311,000 |
| 2022 | $2,449 | $400,000 | $50,000 | $350,000 |
| 2021 | $1,896 | $277,000 | $50,000 | $227,000 |
| 2020 | $1,867 | $252,000 | $78,418 | $173,582 |
| 2019 | $1,733 | $219,000 | $47,357 | $171,643 |
| 2018 | $1,406 | $163,119 | $45,234 | $117,885 |
| 2017 | $1,470 | $162,000 | $41,050 | $120,950 |
| 2016 | $1,326 | $77,700 | $16,500 | $61,200 |
| 2015 | $1,194 | $71,004 | $16,500 | $54,504 |
| 2014 | $1,222 | $72,302 | $17,050 | $55,252 |
Source: Public Records
Map
Nearby Homes
- 2419 W 5850 S
- 484 W 2650 N
- 5810 S 2550 W
- 2190 W 5700 S
- 2564 W 5950 S
- 2144 W 5700 S
- 5643 S 2200 W
- 2105 W 5700 S
- 2593 N 500 W Unit 56
- 2349 Chateau Dr
- 2512 N 475 W
- 2146 W 5600 S Unit 29
- 846 W 2600 N
- 2182 W 5600 S Unit 16
- 2676 W 6050 S
- 5545 S 2100 W Unit 12
- 5545 S 2100 W Unit 20
- 5545 S 2100 W Unit D22
- 5547 S 2150 W
- 2078 W 5600 S
Your Personal Tour Guide
Ask me questions while you tour the home.