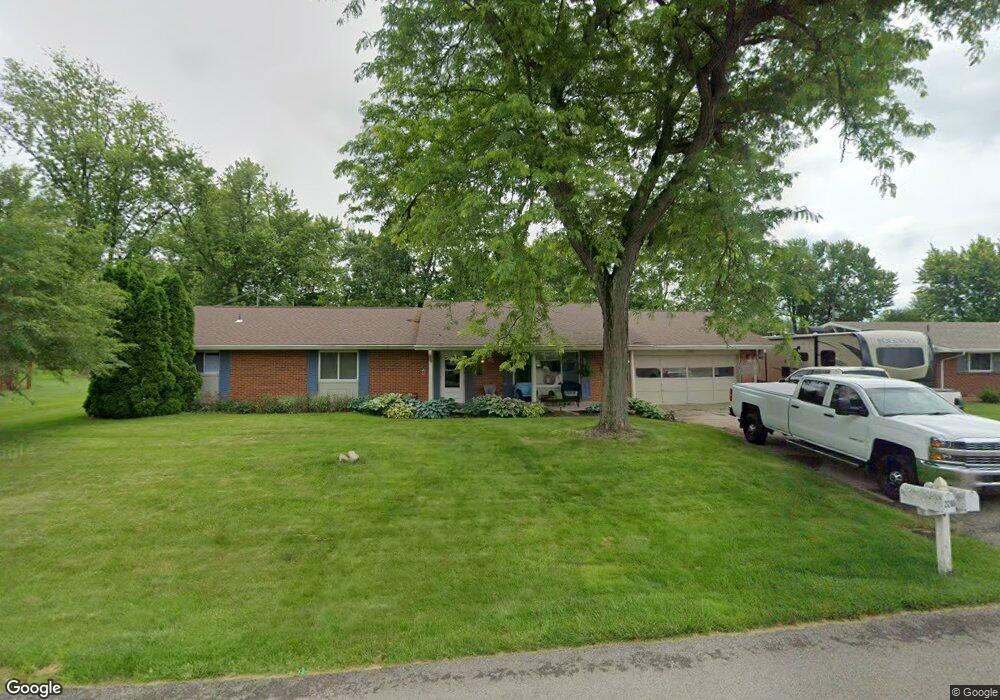
2288 Jacavanda Dr Beavercreek, OH 45431
Estimated Value: $346,000 - $413,000
4
Beds
3
Baths
2,556
Sq Ft
$147/Sq Ft
Est. Value
About This Home
This home is located at 2288 Jacavanda Dr, Beavercreek, OH 45431 and is currently estimated at $376,988, approximately $147 per square foot. 2288 Jacavanda Dr is a home located in Greene County with nearby schools including Main Elementary School, Jacob Coy Middle School, and Beavercreek High School.
Ownership History
Date
Name
Owned For
Owner Type
Purchase Details
Closed on
May 26, 2020
Sold by
Brooks Clifford
Bought by
Brooks Clifford and Gilius Nikka Marie
Current Estimated Value
Home Financials for this Owner
Home Financials are based on the most recent Mortgage that was taken out on this home.
Original Mortgage
$176,200
Outstanding Balance
$122,735
Interest Rate
2.8%
Mortgage Type
New Conventional
Estimated Equity
$254,253
Purchase Details
Closed on
Aug 29, 2003
Sold by
Brooks Mari Jo
Bought by
Brooks Clifford
Home Financials for this Owner
Home Financials are based on the most recent Mortgage that was taken out on this home.
Original Mortgage
$178,946
Interest Rate
5.97%
Mortgage Type
Unknown
Purchase Details
Closed on
Jun 15, 1999
Sold by
Delaski Mark D and Delaski Vicki M
Bought by
Brooks Clifford and Brooks Marijo
Home Financials for this Owner
Home Financials are based on the most recent Mortgage that was taken out on this home.
Original Mortgage
$146,500
Interest Rate
7.15%
Create a Home Valuation Report for This Property
The Home Valuation Report is an in-depth analysis detailing your home's value as well as a comparison with similar homes in the area
Home Values in the Area
Average Home Value in this Area
Purchase History
| Date | Buyer | Sale Price | Title Company |
|---|---|---|---|
| Brooks Clifford | -- | None Available | |
| Brooks Clifford | -- | -- | |
| Brooks Clifford | $146,500 | -- |
Source: Public Records
Mortgage History
| Date | Status | Borrower | Loan Amount |
|---|---|---|---|
| Open | Brooks Clifford | $176,200 | |
| Closed | Brooks Clifford | $178,946 | |
| Closed | Brooks Clifford | $146,500 |
Source: Public Records
Tax History Compared to Growth
Tax History
| Year | Tax Paid | Tax Assessment Tax Assessment Total Assessment is a certain percentage of the fair market value that is determined by local assessors to be the total taxable value of land and additions on the property. | Land | Improvement |
|---|---|---|---|---|
| 2024 | $6,327 | $96,640 | $17,640 | $79,000 |
| 2023 | $6,327 | $96,640 | $17,640 | $79,000 |
| 2022 | $5,587 | $75,300 | $12,600 | $62,700 |
| 2021 | $5,474 | $75,300 | $12,600 | $62,700 |
| 2020 | $5,624 | $75,300 | $12,600 | $62,700 |
| 2019 | $5,122 | $62,600 | $10,410 | $52,190 |
| 2018 | $4,535 | $62,600 | $10,410 | $52,190 |
| 2017 | $4,253 | $62,600 | $10,410 | $52,190 |
| 2016 | $4,253 | $56,850 | $10,410 | $46,440 |
| 2015 | $304 | $56,850 | $10,410 | $46,440 |
| 2014 | $1,456 | $56,850 | $10,410 | $46,440 |
Source: Public Records
Map
Nearby Homes
- 2886 Kemp Rd
- 2930 Coldwater Ct
- 2449 Pine Knott Dr
- 2982 Idaho Falls Dr
- 2725 Terraceview Cir
- 2548 Hillsdale Dr
- 2082 Tamarack Ridge Ct
- 2629 Morning Sun Dr
- 3125 Crestmont Ln Unit 101
- 2691 Majestic Oaks Ct
- 2512 Kemp Rd
- 2550 Township Rd
- 2507 Bent Grass Dr
- 2490 Bent Grass Dr
- 2481 Bent Grass Dr
- 2510 Bent Grass Dr
- 2478 Bent Grass Dr
- 2873 Cove Cir
- 3189 Claydor Dr
- 2504 Bent Grass Dr
- 2276 Jacavanda Dr
- 2298 Jacavanda Dr
- 2297 Pine Knott Dr
- 2307 Pine Knott Dr
- 2872 Zimmer Ct
- 2264 Jacavanda Dr
- 2287 Jacavanda Dr
- 2312 Jacavanda Dr
- 2297 Jacavanda Dr
- 2277 Jacavanda Dr
- 2285 Pine Knott Dr
- 2317 Pine Knott Dr
- 2307 Jacavanda Dr
- 2267 Jacavanda Dr
- 2876 Zimmer Ct
- 2254 Jacavanda Dr
- 2315 Jacavanda Dr
- 2257 Jacavanda Dr
- 2300 Pine Knott Dr
- 2867 Zimmer Ct