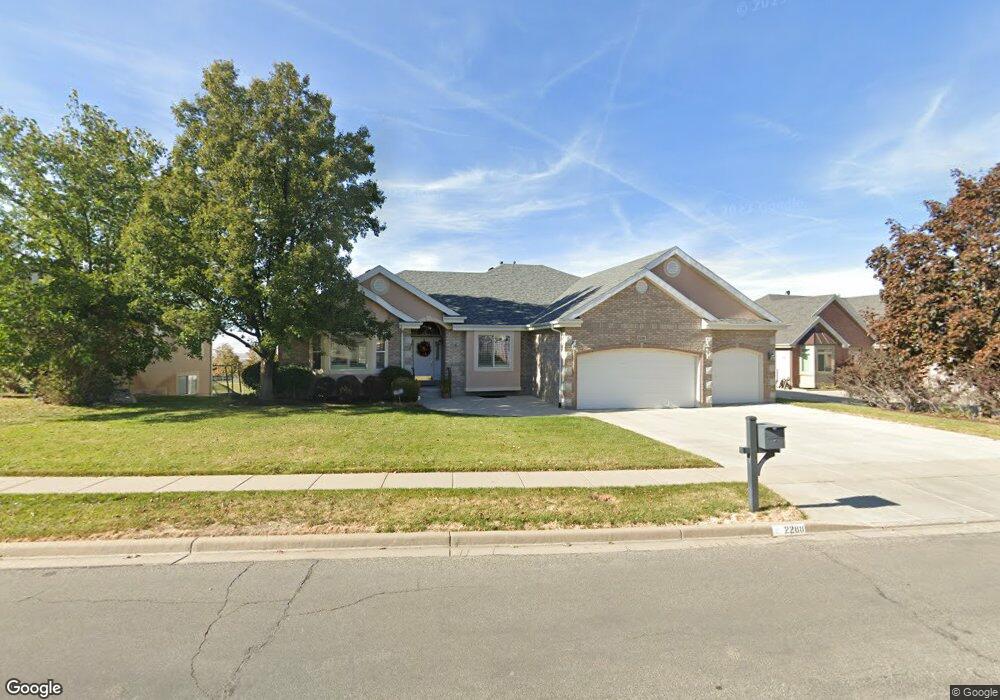
2288 Penman Ln Bountiful, UT 84010
Estimated Value: $642,000 - $800,172
4
Beds
4
Baths
2,670
Sq Ft
$283/Sq Ft
Est. Value
About This Home
This home is located at 2288 Penman Ln, Bountiful, UT 84010 and is currently estimated at $755,043, approximately $282 per square foot. 2288 Penman Ln is a home located in Davis County with nearby schools including Boulton School, South Davis Junior High School, and Woods Cross High School.
Ownership History
Date
Name
Owned For
Owner Type
Purchase Details
Closed on
Dec 10, 1999
Sold by
Symmetry Development Inc
Bought by
Johnson Renita and Johnson Judy M
Current Estimated Value
Home Financials for this Owner
Home Financials are based on the most recent Mortgage that was taken out on this home.
Original Mortgage
$110,000
Interest Rate
7.96%
Purchase Details
Closed on
May 28, 1999
Sold by
Johnson Renita and Johnson Judy M
Bought by
Symmetry Development Inc
Home Financials for this Owner
Home Financials are based on the most recent Mortgage that was taken out on this home.
Original Mortgage
$256,000
Interest Rate
6.9%
Mortgage Type
Construction
Purchase Details
Closed on
Oct 8, 1998
Sold by
Boulton David H and Boulton Sheri
Bought by
Johnson Renita and Johnson Judy M
Purchase Details
Closed on
Nov 18, 1997
Sold by
R & L I Ltd Liability Company
Bought by
Boulton David H and Boulton Sheri
Create a Home Valuation Report for This Property
The Home Valuation Report is an in-depth analysis detailing your home's value as well as a comparison with similar homes in the area
Home Values in the Area
Average Home Value in this Area
Purchase History
| Date | Buyer | Sale Price | Title Company |
|---|---|---|---|
| Johnson Renita | -- | Bonneville Title Company Inc | |
| Symmetry Development Inc | -- | Bonneville Title Company Inc | |
| Johnson Renita | -- | Western States Title Company | |
| Boulton David H | -- | Western States Title Company |
Source: Public Records
Mortgage History
| Date | Status | Borrower | Loan Amount |
|---|---|---|---|
| Closed | Johnson Renita | $110,000 | |
| Previous Owner | Symmetry Development Inc | $256,000 | |
| Closed | Symmetry Development Inc | $88,000 |
Source: Public Records
Tax History Compared to Growth
Tax History
| Year | Tax Paid | Tax Assessment Tax Assessment Total Assessment is a certain percentage of the fair market value that is determined by local assessors to be the total taxable value of land and additions on the property. | Land | Improvement |
|---|---|---|---|---|
| 2025 | $4,852 | $453,200 | $138,507 | $314,693 |
| 2024 | $4,264 | $408,651 | $125,659 | $282,992 |
| 2023 | $4,147 | $721,000 | $229,443 | $491,557 |
| 2022 | $4,256 | $405,901 | $124,823 | $281,078 |
| 2021 | $3,869 | $565,000 | $163,433 | $401,567 |
| 2020 | $3,531 | $519,000 | $138,860 | $380,140 |
| 2019 | $3,446 | $494,000 | $141,657 | $352,343 |
| 2018 | $3,518 | $499,000 | $138,746 | $360,254 |
| 2016 | $3,262 | $251,460 | $55,154 | $196,306 |
| 2015 | $3,438 | $251,130 | $55,154 | $195,976 |
| 2014 | $3,292 | $246,572 | $55,154 | $191,418 |
| 2013 | -- | $209,542 | $67,320 | $142,222 |
Source: Public Records
Map
Nearby Homes
- 33 W Wicker Ln
- 1950 S 200 W Unit 32
- 269 E 2200 S
- 2281 S 250 E
- 2095 S Main St Unit 17
- 2095 S Main St Unit 23
- 320 E 2100 S
- 296 E 2050 S Unit 2
- 2038 S 350 E Unit 3
- 295 E 2050 S Unit 1
- Edgewood A Plan at Oakhaven Park
- Oakhaven Plan at Oakhaven Park
- Fairmont Plan at Oakhaven Park
- Brierwood Plan at Oakhaven Park
- Baychester Plan at Oakhaven Park
- Edgewood B Plan at Oakhaven Park
- 2059 S 350 E Unit 6
- 117 W 3000 S
- 1871 S 350 E
- 2943 S 400 W