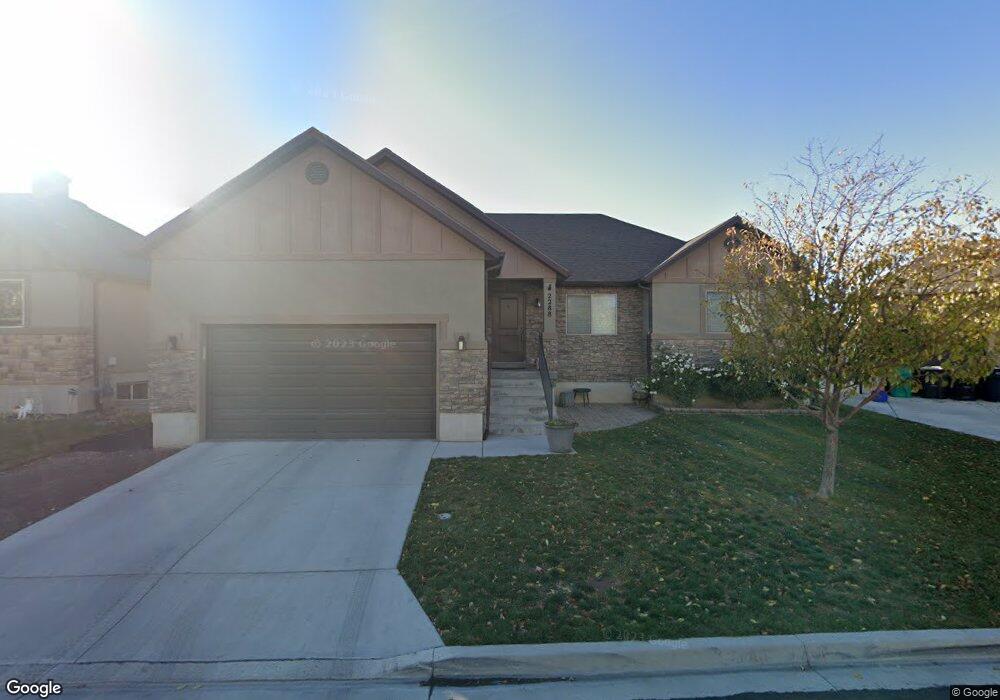
2288 S 2010 W Unit C-210 Woods Cross, UT 84087
Estimated Value: $533,000 - $560,000
3
Beds
2
Baths
1,396
Sq Ft
$394/Sq Ft
Est. Value
About This Home
This home is located at 2288 S 2010 W Unit C-210, Woods Cross, UT 84087 and is currently estimated at $550,043, approximately $394 per square foot. 2288 S 2010 W Unit C-210 is a home located in Davis County with nearby schools including Odyssey School, Mueller Park Junior High School, and Bountiful High School.
Ownership History
Date
Name
Owned For
Owner Type
Purchase Details
Closed on
May 2, 2012
Sold by
Fisher Jeffrey A and Fisher Celia A
Bought by
Fisher Jeffrey A and Fisher Celia A
Current Estimated Value
Home Financials for this Owner
Home Financials are based on the most recent Mortgage that was taken out on this home.
Original Mortgage
$227,469
Outstanding Balance
$158,149
Interest Rate
4.05%
Mortgage Type
VA
Estimated Equity
$391,894
Purchase Details
Closed on
Jun 16, 2010
Sold by
Candlelight Homes Llc
Bought by
Fisher Jeffrey A and Costanzo Celia A
Home Financials for this Owner
Home Financials are based on the most recent Mortgage that was taken out on this home.
Original Mortgage
$233,489
Interest Rate
4.99%
Mortgage Type
VA
Purchase Details
Closed on
Mar 24, 2010
Sold by
Valentine Estates Llc
Bought by
Candlelight Homes Llc
Home Financials for this Owner
Home Financials are based on the most recent Mortgage that was taken out on this home.
Original Mortgage
$60,000
Interest Rate
4.94%
Mortgage Type
Stand Alone Second
Create a Home Valuation Report for This Property
The Home Valuation Report is an in-depth analysis detailing your home's value as well as a comparison with similar homes in the area
Home Values in the Area
Average Home Value in this Area
Purchase History
| Date | Buyer | Sale Price | Title Company |
|---|---|---|---|
| Fisher Jeffrey A | -- | Lincoln Title Insura | |
| Fisher Jeffrey A | -- | Integrated Title Insurance S | |
| Candlelight Homes Llc | -- | Integrated Title Ins Srv |
Source: Public Records
Mortgage History
| Date | Status | Borrower | Loan Amount |
|---|---|---|---|
| Open | Fisher Jeffrey A | $227,469 | |
| Closed | Fisher Jeffrey A | $233,489 | |
| Previous Owner | Candlelight Homes Llc | $60,000 |
Source: Public Records
Tax History Compared to Growth
Tax History
| Year | Tax Paid | Tax Assessment Tax Assessment Total Assessment is a certain percentage of the fair market value that is determined by local assessors to be the total taxable value of land and additions on the property. | Land | Improvement |
|---|---|---|---|---|
| 2025 | $2,899 | $264,550 | $100,055 | $164,495 |
| 2024 | $2,777 | $257,950 | $104,473 | $153,477 |
| 2023 | $2,594 | $445,000 | $136,523 | $308,477 |
| 2022 | $2,669 | $253,550 | $59,447 | $194,103 |
| 2021 | $2,305 | $348,000 | $86,406 | $261,594 |
| 2020 | $2,043 | $305,000 | $81,992 | $223,008 |
| 2019 | $2,133 | $312,000 | $77,461 | $234,539 |
| 2018 | $1,954 | $283,000 | $76,372 | $206,628 |
| 2016 | $1,711 | $132,935 | $30,123 | $102,812 |
| 2015 | $1,721 | $128,535 | $30,123 | $98,412 |
| 2014 | $1,613 | $123,166 | $30,123 | $93,043 |
| 2013 | -- | $118,897 | $27,143 | $91,754 |
Source: Public Records
Map
Nearby Homes
- 1933 W 2295 S
- 2304 S 2060 W
- 2038 W 2185 S
- 1846 W 2280 S
- 908 Halstead Dr
- 828 W Ivywell Ln Unit 220
- 826 W Ivywell Ln Unit 219
- 1022 Allington Dr
- 816 W Ivywell Ln
- 2268 S 2205 W
- 1160 N Clifton Dr Unit 114
- 1156 N Clifton Dr Unit 115
- 1153 N Meridian Ln Unit 120
- 1064 Darcy Dr
- 1971 W 1870 S
- 1024 Newham Ct
- 997 Amberly Dr
- 1066 Bellingham Ct
- 1036 Chidester Dr
- 979 Amberly Dr
- 2288 S 2010 W
- 2294 S 2010 W Unit C-211
- 2284 S 2010 W
- 2284 S 2010 W Unit C-209
- 2289 S 2040 W Unit C-218
- 2297 S 2040 W Unit C-217
- 2297 S 2040 W
- 2281 S 2040 W Unit C-219
- 2281 S 2040 W
- 2291 S 2010 W
- 2293 S 2010 W
- 2302 S 2010 W Unit 212
- 2303 S 2040 W Unit C-216
- 2303 S 2040 W
- 2008 W 2285 S Unit C-208
- 2008 W 2285 S
- 2299 S 2010 W
- 2002 W 2285 S Unit C-207
- 2002 W 2285 S
- 2309 S 2040 W