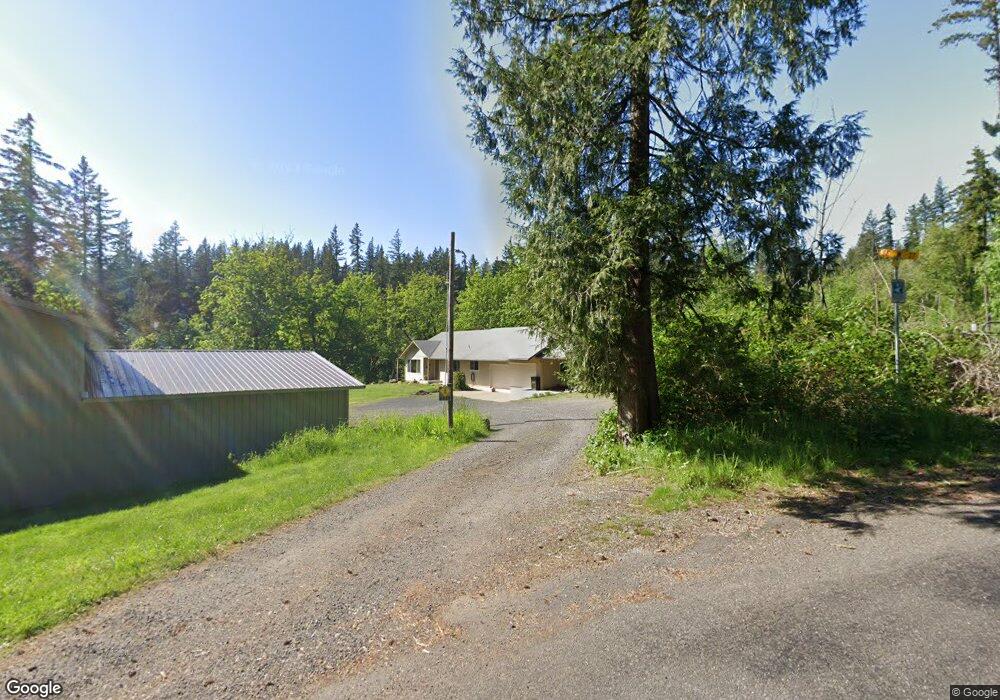
2289 49th St Washougal, WA 98671
Estimated Value: $747,000 - $902,000
3
Beds
4
Baths
2,932
Sq Ft
$281/Sq Ft
Est. Value
About This Home
This home is located at 2289 49th St, Washougal, WA 98671 and is currently estimated at $823,204, approximately $280 per square foot. 2289 49th St is a home located in Clark County with nearby schools including Gause Elementary School, Jemtegaard Middle School, and Washougal High School.
Ownership History
Date
Name
Owned For
Owner Type
Purchase Details
Closed on
Sep 11, 2014
Sold by
Meyer Ryan D and Meyer Deanna K
Bought by
Nixon Ryan and Nixon Robin
Current Estimated Value
Home Financials for this Owner
Home Financials are based on the most recent Mortgage that was taken out on this home.
Original Mortgage
$37,900
Outstanding Balance
$28,961
Interest Rate
4.09%
Mortgage Type
Credit Line Revolving
Estimated Equity
$794,243
Purchase Details
Closed on
Dec 28, 2012
Sold by
Hartwood Homes Inc
Bought by
Meyer Ryan D and Meyer Deanna K
Purchase Details
Closed on
Dec 28, 2010
Sold by
Hartwood Homes Inc
Bought by
City Of Washougal
Purchase Details
Closed on
Nov 20, 2008
Sold by
Garrett Susan Carol
Bought by
Hartwood Homes Inc
Create a Home Valuation Report for This Property
The Home Valuation Report is an in-depth analysis detailing your home's value as well as a comparison with similar homes in the area
Home Values in the Area
Average Home Value in this Area
Purchase History
| Date | Buyer | Sale Price | Title Company |
|---|---|---|---|
| Nixon Ryan | $379,219 | Columbia Title Agency | |
| Meyer Ryan D | -- | Stewart Title | |
| City Of Washougal | -- | Stewart Title | |
| Hartwood Homes Inc | $425,000 | Clark County Title Co |
Source: Public Records
Mortgage History
| Date | Status | Borrower | Loan Amount |
|---|---|---|---|
| Open | Nixon Ryan | $37,900 | |
| Open | Nixon Ryan | $303,200 |
Source: Public Records
Tax History Compared to Growth
Tax History
| Year | Tax Paid | Tax Assessment Tax Assessment Total Assessment is a certain percentage of the fair market value that is determined by local assessors to be the total taxable value of land and additions on the property. | Land | Improvement |
|---|---|---|---|---|
| 2025 | $6,383 | $616,203 | $146,933 | $469,270 |
| 2024 | $5,714 | $669,103 | $213,053 | $456,050 |
| 2023 | $5,896 | $618,413 | $202,768 | $415,645 |
| 2022 | $5,474 | $633,046 | $208,645 | $424,401 |
| 2021 | $5,298 | $509,646 | $164,565 | $345,081 |
| 2020 | $4,675 | $463,361 | $146,933 | $316,428 |
| 2019 | $4,346 | $414,910 | $146,933 | $267,977 |
| 2018 | $4,604 | $407,749 | $0 | $0 |
| 2017 | $3,874 | $356,757 | $0 | $0 |
| 2016 | $4,064 | $329,240 | $0 | $0 |
| 2015 | $3,654 | $315,985 | $0 | $0 |
| 2014 | -- | $282,373 | $0 | $0 |
| 2013 | -- | $235,838 | $0 | $0 |
Source: Public Records
Map
Nearby Homes