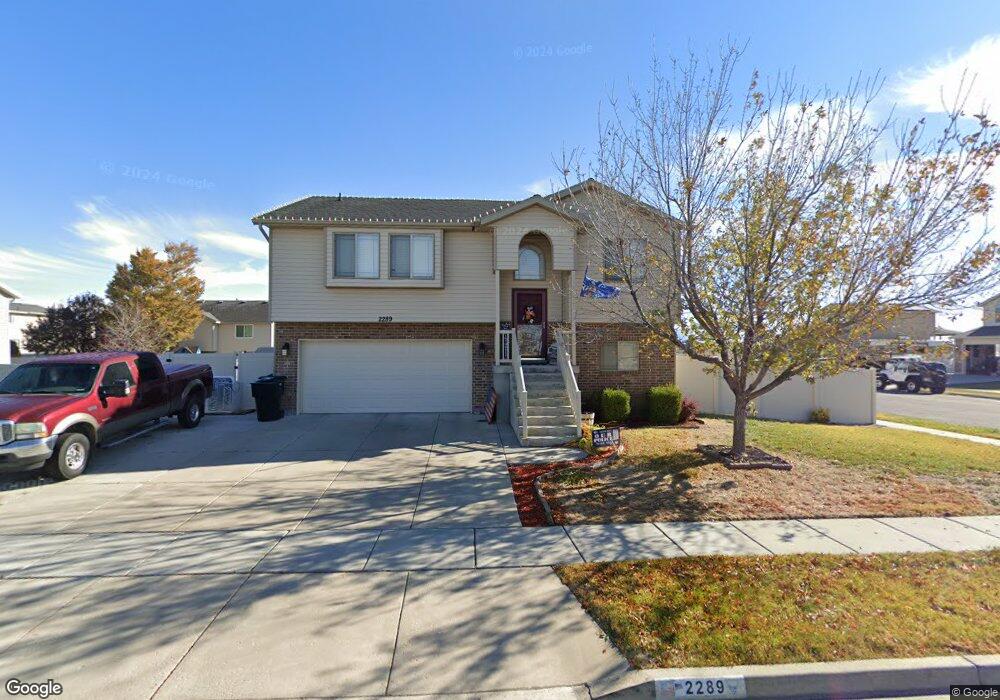
2289 S 2685 W Syracuse, UT 84075
Estimated Value: $440,000 - $482,000
4
Beds
3
Baths
1,652
Sq Ft
$282/Sq Ft
Est. Value
About This Home
This home is located at 2289 S 2685 W, Syracuse, UT 84075 and is currently estimated at $466,394, approximately $282 per square foot. 2289 S 2685 W is a home located in Davis County with nearby schools including Buffalo Point School, Syracuse Junior High School, and Syracuse High School.
Ownership History
Date
Name
Owned For
Owner Type
Purchase Details
Closed on
May 30, 2018
Sold by
Moore Christopher M and Moore Emily Ann
Bought by
Robinson Colton C and Seifert Gwendoline M
Current Estimated Value
Purchase Details
Closed on
Jul 28, 2017
Sold by
Moore Christopher M and Moore Emily Ann
Bought by
Moore Christopher M and Moore Emily A
Home Financials for this Owner
Home Financials are based on the most recent Mortgage that was taken out on this home.
Original Mortgage
$249,986
Interest Rate
3.9%
Mortgage Type
VA
Purchase Details
Closed on
Mar 11, 2005
Sold by
Lessiq Gary and Snow Ron
Bought by
Moore Christopher M and Moore Emily Ann
Home Financials for this Owner
Home Financials are based on the most recent Mortgage that was taken out on this home.
Original Mortgage
$143,010
Interest Rate
5.65%
Mortgage Type
VA
Purchase Details
Closed on
Aug 9, 2004
Sold by
Out West Developers Llc
Bought by
Lessig Gary and Snow Ron
Home Financials for this Owner
Home Financials are based on the most recent Mortgage that was taken out on this home.
Original Mortgage
$10,000
Interest Rate
6.17%
Mortgage Type
Seller Take Back
Create a Home Valuation Report for This Property
The Home Valuation Report is an in-depth analysis detailing your home's value as well as a comparison with similar homes in the area
Home Values in the Area
Average Home Value in this Area
Purchase History
| Date | Buyer | Sale Price | Title Company |
|---|---|---|---|
| Robinson Colton C | -- | North American Title | |
| Moore Christopher M | -- | Us Title | |
| Moore Christopher M | -- | Heritage West Title Ins Agen | |
| Lessig Gary | -- | Heritage West Title Insuranc |
Source: Public Records
Mortgage History
| Date | Status | Borrower | Loan Amount |
|---|---|---|---|
| Previous Owner | Moore Christopher M | $249,986 | |
| Previous Owner | Moore Christopher M | $143,010 | |
| Previous Owner | Lessig Gary | $10,000 |
Source: Public Records
Tax History Compared to Growth
Tax History
| Year | Tax Paid | Tax Assessment Tax Assessment Total Assessment is a certain percentage of the fair market value that is determined by local assessors to be the total taxable value of land and additions on the property. | Land | Improvement |
|---|---|---|---|---|
| 2025 | $2,361 | $238,150 | $99,646 | $138,504 |
| 2024 | $2,361 | $229,350 | $76,762 | $152,588 |
| 2023 | $2,187 | $387,000 | $119,953 | $267,047 |
| 2022 | $2,375 | $230,450 | $58,452 | $171,998 |
| 2021 | $2,091 | $314,000 | $85,420 | $228,580 |
| 2020 | $1,857 | $270,000 | $67,112 | $202,888 |
| 2019 | $1,783 | $256,000 | $71,679 | $184,321 |
| 2018 | $1,345 | $197,076 | $70,319 | $126,757 |
| 2016 | $999 | $99,990 | $30,274 | $69,716 |
| 2015 | $1,310 | $93,225 | $30,274 | $62,951 |
| 2014 | $978 | $95,787 | $30,274 | $65,513 |
| 2013 | -- | $89,313 | $25,850 | $63,463 |
Source: Public Records
Map
Nearby Homes
- 2236 S 2685 W
- 2641 W 2175 S
- 2726 2495 S Unit 205
- 2815 W 2435 S
- 2664 S 2439 W Unit 104
- 3062 W Solace St
- 2635 S 2430 W Unit 114
- 2686 S 2440 W Unit 101
- 2625 S 2430 W Unit 112
- 2297 W 2175 S
- 1918 S 2465 W
- 2735 S Shoreline Dr
- 2237 Craig Ln
- Sadie's Glen Plan at Sadie's Glenn
- Sullivan Plan at Sadie's Glenn
- Malan Plan at Sadie's Glenn
- Havenwood with Loft Plan at Sadie's Glenn
- Havenwood Plan at Sadie's Glenn
- Hamilton Plan at Sadie's Glenn
- Bridgeport Plan at Sadie's Glenn