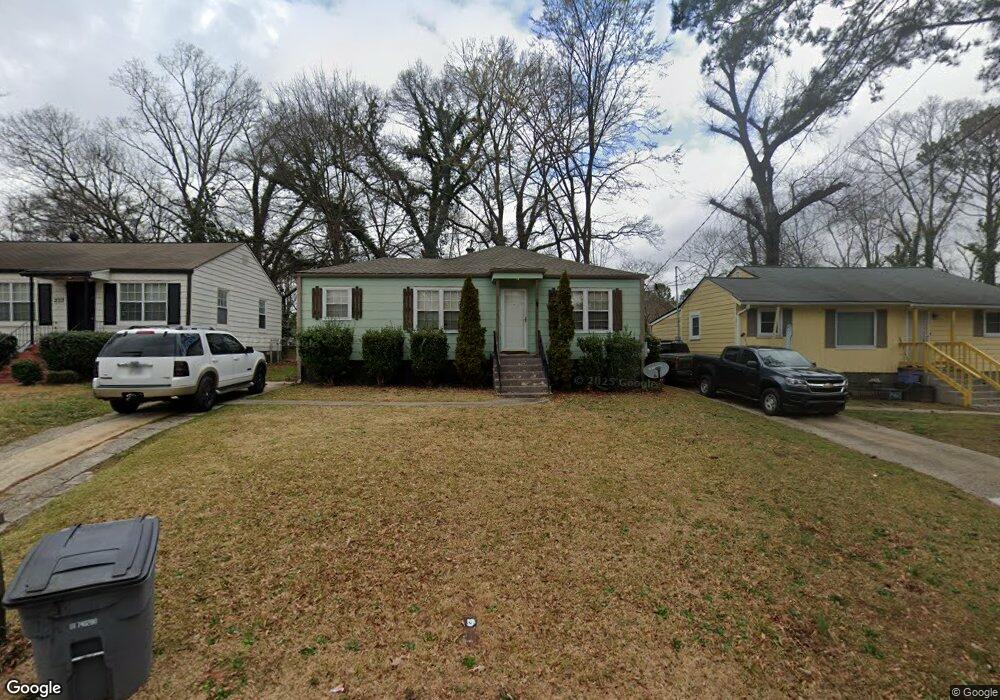
229 Birch St Atlanta, GA 30354
Estimated Value: $126,000 - $214,000
2
Beds
1
Bath
999
Sq Ft
$181/Sq Ft
Est. Value
About This Home
This home is located at 229 Birch St, Atlanta, GA 30354 and is currently estimated at $181,313, approximately $181 per square foot. 229 Birch St is a home located in Fulton County with nearby schools including Hapeville Elementary School, Paul D. West Middle School, and Tri-Cities High School.
Ownership History
Date
Name
Owned For
Owner Type
Purchase Details
Closed on
Nov 15, 2013
Sold by
Hurt Curtis
Bought by
Craven Alan
Current Estimated Value
Home Financials for this Owner
Home Financials are based on the most recent Mortgage that was taken out on this home.
Original Mortgage
$45,000
Outstanding Balance
$33,665
Interest Rate
4.31%
Mortgage Type
New Conventional
Estimated Equity
$147,648
Purchase Details
Closed on
Aug 12, 2009
Sold by
Federal National Mortgage Association
Bought by
Hurt Curtis
Purchase Details
Closed on
Jun 2, 2009
Sold by
Citimortgage Inc
Bought by
Federal National Mortgage Association
Create a Home Valuation Report for This Property
The Home Valuation Report is an in-depth analysis detailing your home's value as well as a comparison with similar homes in the area
Home Values in the Area
Average Home Value in this Area
Purchase History
| Date | Buyer | Sale Price | Title Company |
|---|---|---|---|
| Craven Alan | $45,000 | -- | |
| Hurt Curtis | $21,000 | -- | |
| Federal National Mortgage Association | -- | -- | |
| Cimortgage Inc | $58,856 | -- |
Source: Public Records
Mortgage History
| Date | Status | Borrower | Loan Amount |
|---|---|---|---|
| Open | Craven Alan | $45,000 |
Source: Public Records
Tax History Compared to Growth
Tax History
| Year | Tax Paid | Tax Assessment Tax Assessment Total Assessment is a certain percentage of the fair market value that is determined by local assessors to be the total taxable value of land and additions on the property. | Land | Improvement |
|---|---|---|---|---|
| 2025 | $1,172 | $59,840 | $19,400 | $40,440 |
| 2023 | $1,172 | $66,960 | $23,680 | $43,280 |
| 2022 | $1,599 | $60,760 | $30,240 | $30,520 |
| 2021 | $1,906 | $44,480 | $19,920 | $24,560 |
| 2020 | $1,710 | $39,040 | $16,920 | $22,120 |
| 2019 | $571 | $35,440 | $6,680 | $28,760 |
| 2018 | $977 | $34,600 | $6,520 | $28,080 |
| 2017 | $432 | $14,800 | $4,840 | $9,960 |
| 2016 | $432 | $14,800 | $4,840 | $9,960 |
| 2015 | $680 | $14,800 | $4,840 | $9,960 |
| 2014 | $454 | $14,800 | $4,840 | $9,960 |
Source: Public Records
Map
Nearby Homes