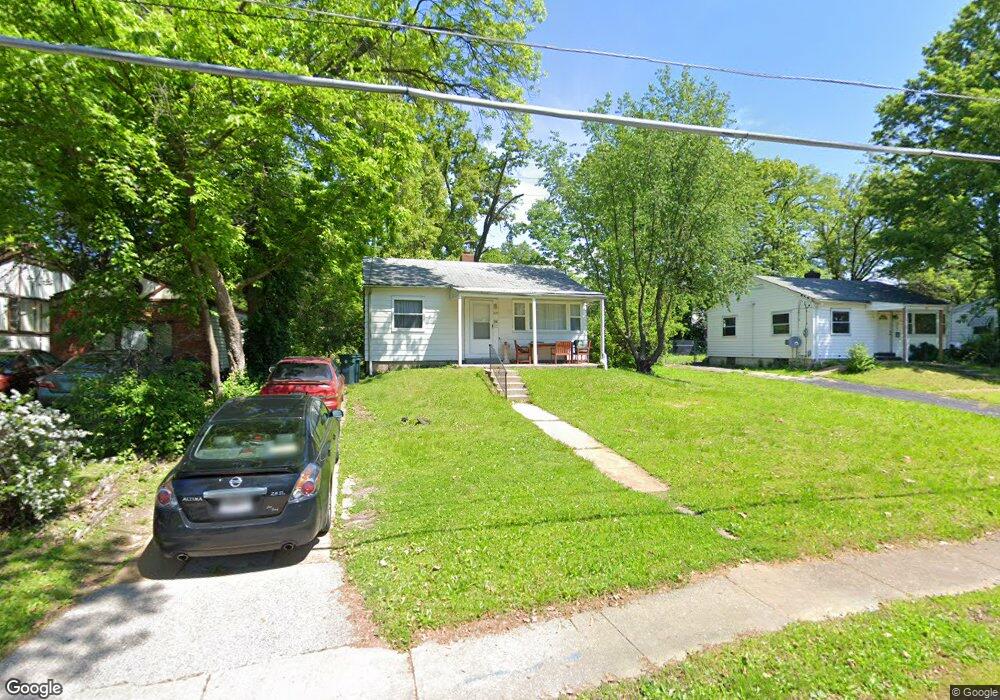
229 Commerce Ave Saint Louis, MO 63122
Estimated Value: $164,000 - $186,000
2
Beds
1
Bath
672
Sq Ft
$259/Sq Ft
Est. Value
About This Home
This home is located at 229 Commerce Ave, Saint Louis, MO 63122 and is currently estimated at $174,042, approximately $258 per square foot. 229 Commerce Ave is a home located in St. Louis County with nearby schools including George R. Robinson Elementary School, Nipher Middle School, and Kirkwood Senior High School.
Ownership History
Date
Name
Owned For
Owner Type
Purchase Details
Closed on
Dec 31, 2024
Sold by
Cab Llc
Bought by
Mb 229 Commerce Llc
Current Estimated Value
Purchase Details
Closed on
Aug 8, 2012
Sold by
Buchheit Catherine
Bought by
Cab Llc
Purchase Details
Closed on
Mar 23, 2012
Sold by
Midland States Bank
Bought by
Buchheit Catherine
Purchase Details
Closed on
Aug 20, 2010
Sold by
Eighteen Investments Inc
Bought by
Midland States Bank
Purchase Details
Closed on
Sep 23, 2005
Sold by
Eighteen Investments Inc
Bought by
Anacott Properties Llc
Purchase Details
Closed on
Jun 14, 2005
Sold by
Anacott Properties Llc
Bought by
Eighteen Investments Inc
Home Financials for this Owner
Home Financials are based on the most recent Mortgage that was taken out on this home.
Original Mortgage
$66,200
Interest Rate
5.67%
Mortgage Type
Purchase Money Mortgage
Purchase Details
Closed on
May 23, 2000
Sold by
Long Beach Mtg Company
Bought by
Anacott Properties Llc
Purchase Details
Closed on
Jan 21, 1998
Sold by
Waters Lorraine E
Bought by
Waters Leon Donnell
Create a Home Valuation Report for This Property
The Home Valuation Report is an in-depth analysis detailing your home's value as well as a comparison with similar homes in the area
Home Values in the Area
Average Home Value in this Area
Purchase History
| Date | Buyer | Sale Price | Title Company |
|---|---|---|---|
| Mb 229 Commerce Llc | -- | None Listed On Document | |
| Cab Llc | -- | None Available | |
| Buchheit Catherine | $29,000 | Investors Title Company Clay | |
| Midland States Bank | $57,481 | None Available | |
| Anacott Properties Llc | -- | -- | |
| Eighteen Investments Inc | -- | -- | |
| Anacott Properties Llc | $23,100 | -- | |
| Waters Leon Donnell | -- | -- |
Source: Public Records
Mortgage History
| Date | Status | Borrower | Loan Amount |
|---|---|---|---|
| Previous Owner | Eighteen Investments Inc | $66,200 |
Source: Public Records
Tax History
| Year | Tax Paid | Tax Assessment Tax Assessment Total Assessment is a certain percentage of the fair market value that is determined by local assessors to be the total taxable value of land and additions on the property. | Land | Improvement |
|---|---|---|---|---|
| 2025 | $1,404 | $24,530 | $15,690 | $8,840 |
| 2024 | $1,404 | $22,060 | $8,040 | $14,020 |
| 2023 | $1,382 | $22,060 | $8,040 | $14,020 |
| 2022 | $1,164 | $15,960 | $9,040 | $6,920 |
| 2021 | $1,055 | $20,210 | $9,040 | $11,170 |
| 2020 | $1,038 | $15,100 | $5,870 | $9,230 |
| 2019 | $1,049 | $15,100 | $5,870 | $9,230 |
| 2018 | $784 | $9,880 | $5,870 | $4,010 |
| 2017 | $783 | $9,880 | $5,870 | $4,010 |
| 2016 | $737 | $9,350 | $3,970 | $5,380 |
| 2015 | $736 | $9,350 | $3,970 | $5,380 |
| 2014 | $806 | $10,050 | $3,400 | $6,650 |
Source: Public Records
Map
Nearby Homes
- 709 S Fillmore Ave
- 629 S Fillmore Ave
- 667 S Kirkwood Rd Unit 102
- 341 New York St
- 621 S Kirkwood Rd Unit 202
- 630 Candleberry Ct Unit D
- 233 Midway Ave
- 219 E Woodbine Ave
- 320 Saratoga St
- 335 Electric St
- 322 Midway Ave
- 117 E Clinton Place Unit 7
- 125 E Clinton Place Unit 1C
- 338 W Rose Hill Ave
- 127 E Clinton Place Unit 1B
- 318 Chicago St
- 301 Memphis St
- 503 Acorn Dr
- 343 Memphis St
- 939 Oak Ridge Ave
- 235 Commerce Ave
- 225 Commerce Ave
- 202 Commerce Ave
- 241 Commerce Ave
- 219 Commerce Ave
- 900 Ohlman Ave
- 215 Commerce Ave
- 245 Commerce Ave
- 242 Commerce Ave
- 807 S Fillmore Ave
- 218 Commerce Ave
- 250 Commerce Ave
- 209 Commerce Ave
- 910 Ohlman Ave
- 251 Commerce Ave
- 914 Ohlman Ave
- 164 E Rose Hill Ave
- 160 E Rose Hill Ave
- 256 Commerce Ave
- 911 Ohlman Ave
Your Personal Tour Guide
Ask me questions while you tour the home.