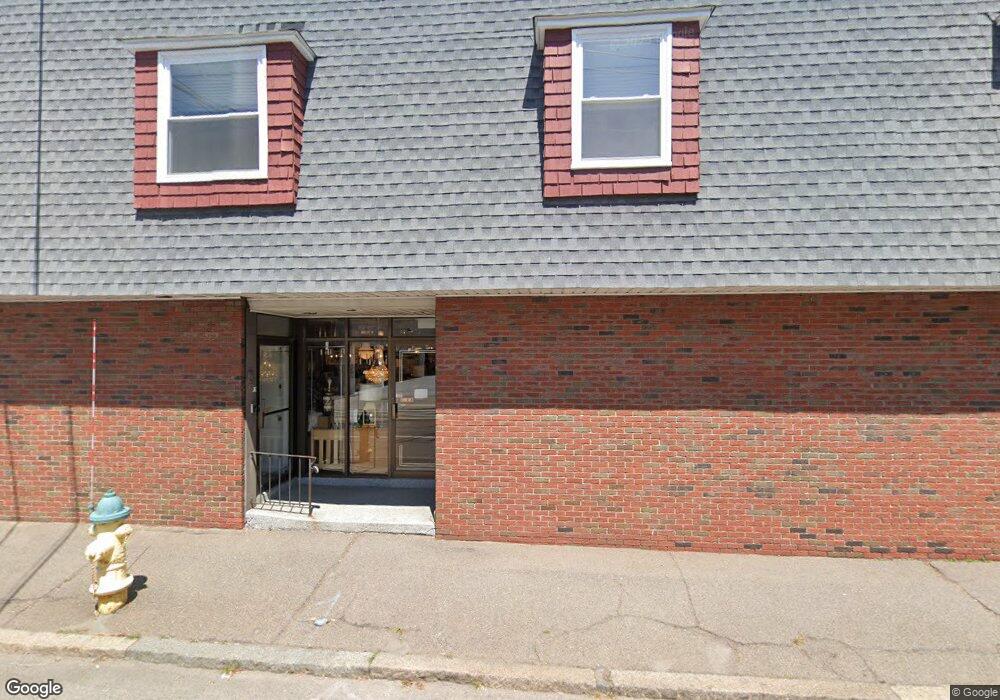
229 Copeland St Unit 2nd Floor Quincy, MA 02169
South Quincy Neighborhood
--
Bed
2
Baths
5,350
Sq Ft
9,583
Sq Ft Lot
About This Home
This home is located at 229 Copeland St Unit 2nd Floor, Quincy, MA 02169. 229 Copeland St Unit 2nd Floor is a home located in Norfolk County with nearby schools including South West Middle School, Lincoln-Hancock Community School, and Quincy High School.
Ownership History
Date
Name
Owned For
Owner Type
Purchase Details
Closed on
Mar 28, 2012
Sold by
Copelan Roycharles 229 and Edwards Charles N
Bought by
L Edwards-Riseberg Ret and Edwards Charles N
Purchase Details
Closed on
Feb 12, 1981
Bought by
Edwards Charles N
Create a Home Valuation Report for This Property
The Home Valuation Report is an in-depth analysis detailing your home's value as well as a comparison with similar homes in the area
Home Values in the Area
Average Home Value in this Area
Purchase History
| Date | Buyer | Sale Price | Title Company |
|---|---|---|---|
| L Edwards-Riseberg Ret | -- | -- | |
| Edwards Charles N | -- | -- |
Source: Public Records
Tax History Compared to Growth
Tax History
| Year | Tax Paid | Tax Assessment Tax Assessment Total Assessment is a certain percentage of the fair market value that is determined by local assessors to be the total taxable value of land and additions on the property. | Land | Improvement |
|---|---|---|---|---|
| 2025 | $17,810 | $774,000 | $137,800 | $636,200 |
| 2024 | $16,337 | $727,700 | $136,400 | $591,300 |
| 2023 | $15,457 | $696,900 | $135,100 | $561,800 |
| 2022 | $15,807 | $662,500 | $128,700 | $533,800 |
| 2021 | $15,450 | $637,900 | $127,400 | $510,500 |
| 2020 | $15,388 | $619,500 | $126,100 | $493,400 |
| 2019 | $15,294 | $607,400 | $124,900 | $482,500 |
| 2018 | $16,267 | $601,600 | $123,600 | $478,000 |
| 2017 | $15,139 | $527,300 | $120,000 | $407,300 |
| 2016 | $14,676 | $499,700 | $120,000 | $379,700 |
| 2015 | $15,118 | $499,600 | $120,000 | $379,600 |
| 2014 | $15,565 | $498,400 | $120,000 | $378,400 |
Source: Public Records
Map
Nearby Homes
- 211 Copeland St
- 42 West St
- 57 Buckley St
- 46-48 Buckley St
- 46 Suomi Rd
- 46 Suomi Rd Unit 46
- 510 Willard St
- 14 Arthur Ave
- 12 Arthur Ave
- 21 Arthur St
- 1 Cityview Ln Unit 506
- 1 Cityview Ln Unit 210
- 1 Cityview Ln Unit 709
- 211 West St Unit 12B
- 91 Garfield St
- 64 Garfield St Unit B
- 25 Carrolls Ln
- 52 Bunker Hill Ln
- 73 Connell St
- 63 Adele Rd
- 1235 Furnace Brook Pkwy
- 1235 Furnace Brook Pkwy Unit 2nd Floor
- 237-239 Copeland St Unit B
- 237-239 Copeland St
- 237 Copeland St
- 0X Crescent St Unit OX
- 1240 Furnace Brook Pkwy Unit 1248
- 1240 Furnace Brook Pkwy Unit 2
- 10 Crescent St
- 1261 Furnace Brook Pkwy Unit 16
- 1261 Furnace Brook Pkwy Unit 18
- 1261 Furnace Brook Pkwy Unit 32
- 1261 Furnace Brook Pkwy Unit 36
- 1261 Furnace Brook Pkwy Unit 22
- 1261 Furnace Brook Pkwy Unit 20
- 1261 Furnace Brook Pkwy
- 1244 Furnace Brook Pkwy Unit 1
- 1244 Furnace Brook Pkwy Unit PRKY
- 1234 Furnace Brook Pkwy
- 1234 Furnace Brook Pkwy Unit 2