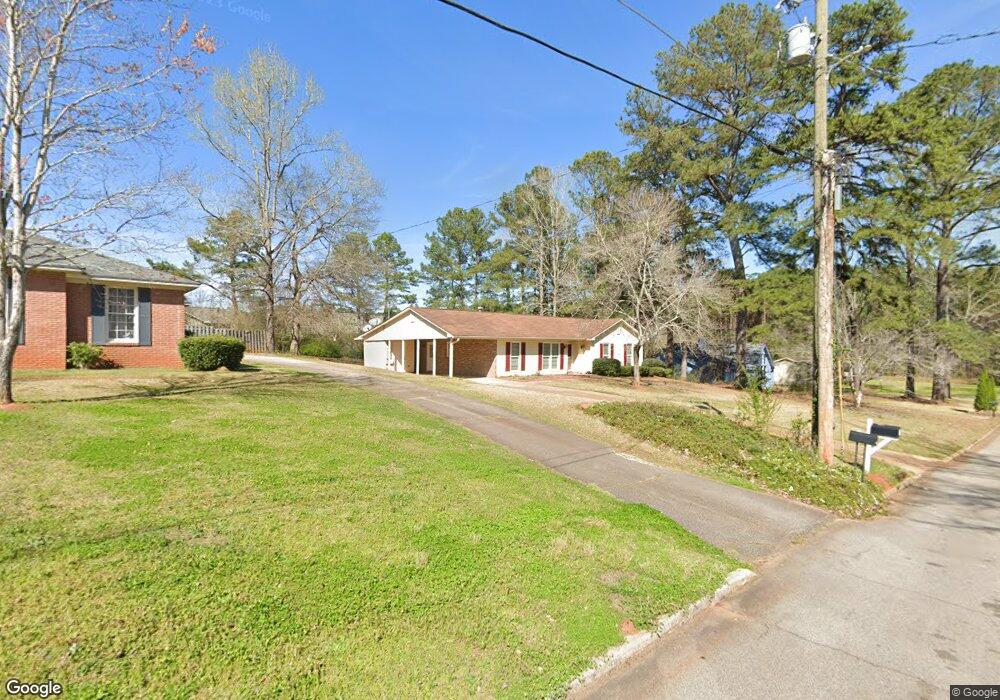
229 Cosby Dr Lagrange, GA 30241
Estimated Value: $182,000 - $226,000
3
Beds
2
Baths
1,540
Sq Ft
$134/Sq Ft
Est. Value
About This Home
This home is located at 229 Cosby Dr, Lagrange, GA 30241 and is currently estimated at $206,793, approximately $134 per square foot. 229 Cosby Dr is a home located in Troup County with nearby schools including Franklin Forest Elementary School, Hollis Hand Elementary School, and Ethel W. Kight Elementary School.
Ownership History
Date
Name
Owned For
Owner Type
Purchase Details
Closed on
Mar 3, 2020
Sold by
Yarbrough Terry
Bought by
Carter Christie Nicole
Current Estimated Value
Home Financials for this Owner
Home Financials are based on the most recent Mortgage that was taken out on this home.
Original Mortgage
$126,000
Outstanding Balance
$110,646
Interest Rate
3.4%
Mortgage Type
New Conventional
Estimated Equity
$96,147
Purchase Details
Closed on
Aug 11, 1995
Sold by
Belinda Yarbrough
Bought by
Yarbrough Tony
Purchase Details
Closed on
Apr 24, 1986
Sold by
Rebecca Michael P and Rebecca Payant
Bought by
Belinda Yarbrough
Purchase Details
Closed on
Apr 26, 1979
Sold by
Spencer Rober B and Spencer Annie L
Bought by
Rebecca Michael P and Rebecca Payant
Purchase Details
Closed on
Sep 3, 1976
Sold by
Becklin Co
Bought by
Spencer Rober B and Spencer Annie L
Purchase Details
Closed on
May 28, 1976
Sold by
Cotton S B
Bought by
Becklin Co
Purchase Details
Closed on
Jul 18, 1975
Bought by
Cotton S B
Purchase Details
Closed on
Jan 1, 1971
Create a Home Valuation Report for This Property
The Home Valuation Report is an in-depth analysis detailing your home's value as well as a comparison with similar homes in the area
Purchase History
| Date | Buyer | Sale Price | Title Company |
|---|---|---|---|
| Carter Christie Nicole | $129,900 | -- | |
| Yarbrough Tony | -- | -- | |
| Belinda Yarbrough | $62,700 | -- | |
| Rebecca Michael P | -- | -- | |
| Spencer Rober B | -- | -- | |
| Becklin Co | -- | -- | |
| Cotton S B | -- | -- | |
| -- | -- | -- |
Source: Public Records
Mortgage History
| Date | Status | Borrower | Loan Amount |
|---|---|---|---|
| Open | Carter Christie Nicole | $126,000 |
Source: Public Records
Tax History
| Year | Tax Paid | Tax Assessment Tax Assessment Total Assessment is a certain percentage of the fair market value that is determined by local assessors to be the total taxable value of land and additions on the property. | Land | Improvement |
|---|---|---|---|---|
| 2025 | $1,775 | $73,720 | $10,000 | $63,720 |
| 2024 | $1,775 | $65,080 | $10,000 | $55,080 |
| 2023 | $1,644 | $60,280 | $10,000 | $50,280 |
| 2022 | $1,510 | $54,120 | $8,000 | $46,120 |
| 2021 | $1,477 | $48,960 | $8,000 | $40,960 |
| 2020 | $1,176 | $48,960 | $8,000 | $40,960 |
| 2019 | $857 | $38,364 | $6,364 | $32,000 |
| 2018 | $857 | $38,364 | $6,364 | $32,000 |
| 2017 | $857 | $38,364 | $6,364 | $32,000 |
| 2016 | $857 | $38,375 | $6,364 | $32,011 |
| 2015 | $858 | $38,375 | $6,364 | $32,011 |
| 2014 | $807 | $36,690 | $6,364 | $30,326 |
| 2013 | -- | $39,770 | $6,364 | $33,406 |
Source: Public Records
Map
Nearby Homes
- 134 S Page St
- 129 Celebration Blvd
- 517 Tradition Place
- 519 Tradition Place
- 112 Celebration Blvd
- 114 Briarcliff Rd
- 793 Celebration Blvd
- 509 Youngs Mill Rd
- 200 Crestwood Dr
- 806 New Franklin Rd
- 210 Hearthstone Dr
- 204 Colonial St
- 203 Bonaventure Dr
- 105 Ridgefield Dr
- 202 Park Hill Dr
- 110 Lenox Cir
- 224 Rutland Cir
- 102 Dogwood Dr
- 110 Russell St
- 115 Clara Jean Ct
- 231 Cosby Dr
- 227 Cosby Dr
- 510 S Page St
- 510 S Page St Unit LOT 29
- 500 S Page St Unit LOT 30
- 520 S Page St Unit LOT 28
- 233 Cosby Dr
- 225 Cosby Dr
- 230 Cosby Dr
- 530 S Page St Unit LOT 67
- 530 S Page St Unit LOT 27
- 530 S Page St
- 480 S Page St
- 228 Cosby Dr
- 208 Woodbine Dr
- 470 S Page St
- 470 S Page St Unit 470
- 120 Stoney Creek Dr Unit LOT 62A
- 130 Stoney Creek Dr
- 130 Stoney Creek Dr Unit LOT 63A
Your Personal Tour Guide
Ask me questions while you tour the home.