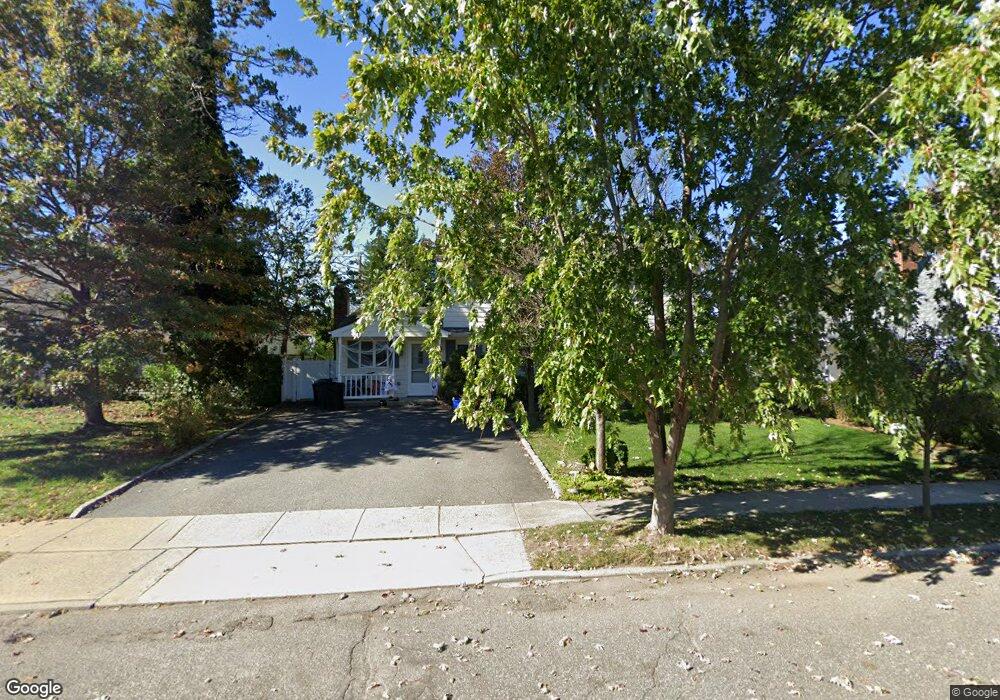
229 Cypress Ln W Westbury, NY 11590
Estimated Value: $839,000 - $857,628
4
Beds
2
Baths
2,185
Sq Ft
$388/Sq Ft
Est. Value
About This Home
This home is located at 229 Cypress Ln W, Westbury, NY 11590 and is currently estimated at $848,314, approximately $388 per square foot. 229 Cypress Ln W is a home located in Nassau County with nearby schools including Bowling Green Elementary School, Carousel Day School, and Long Island Christian Academy.
Ownership History
Date
Name
Owned For
Owner Type
Purchase Details
Closed on
Aug 26, 2020
Sold by
Russell Vanessa A
Bought by
Jackson Todd A and Jackson Vanessa A
Current Estimated Value
Purchase Details
Closed on
Nov 23, 2019
Sold by
Russell Vanessa A
Bought by
Jackson Todd A and Jackson Vanessa A
Home Financials for this Owner
Home Financials are based on the most recent Mortgage that was taken out on this home.
Original Mortgage
$574,168
Interest Rate
4.62%
Mortgage Type
FHA
Purchase Details
Closed on
May 20, 2004
Sold by
Bonora Frank
Purchase Details
Closed on
Jun 22, 2001
Sold by
Dean Edward and Dean Linda Ann
Bought by
Bonora Frank and Bonora Sebastiana
Purchase Details
Closed on
Feb 26, 1998
Purchase Details
Closed on
Aug 22, 1997
Sold by
Wahl Henry G and Wahl Diana L
Bought by
Dean Edward
Create a Home Valuation Report for This Property
The Home Valuation Report is an in-depth analysis detailing your home's value as well as a comparison with similar homes in the area
Home Values in the Area
Average Home Value in this Area
Purchase History
| Date | Buyer | Sale Price | Title Company |
|---|---|---|---|
| Jackson Todd A | -- | None Available | |
| Jackson Todd A | -- | None Available | |
| Jackson Todd A | -- | None Available | |
| Jackson Todd A | -- | None Available | |
| Jackson Todd A | -- | None Available | |
| Jackson Todd A | -- | None Available | |
| -- | -- | -- | |
| -- | -- | -- | |
| Bonora Frank | $296,000 | Russell Burchetti | |
| Bonora Frank | $296,000 | Russell Burchetti | |
| -- | -- | -- | |
| -- | -- | -- | |
| Dean Edward | $177,500 | -- | |
| Dean Edward | $177,500 | -- |
Source: Public Records
Mortgage History
| Date | Status | Borrower | Loan Amount |
|---|---|---|---|
| Previous Owner | Jackson Todd A | $574,168 |
Source: Public Records
Tax History Compared to Growth
Tax History
| Year | Tax Paid | Tax Assessment Tax Assessment Total Assessment is a certain percentage of the fair market value that is determined by local assessors to be the total taxable value of land and additions on the property. | Land | Improvement |
|---|---|---|---|---|
| 2025 | $11,576 | $529 | $239 | $290 |
| 2024 | $3,981 | $563 | $254 | $309 |
| 2023 | $12,520 | $503 | $254 | $249 |
| 2022 | $12,520 | $503 | $254 | $249 |
| 2021 | $15,993 | $489 | $247 | $242 |
| 2020 | $12,952 | $843 | $595 | $248 |
| 2019 | $4,367 | $843 | $595 | $248 |
| 2018 | $4,252 | $843 | $0 | $0 |
| 2017 | $7,085 | $843 | $595 | $248 |
| 2016 | $11,142 | $843 | $595 | $248 |
| 2015 | $3,675 | $835 | $595 | $240 |
| 2014 | $3,675 | $835 | $595 | $240 |
| 2013 | $4,072 | $835 | $595 | $240 |
Source: Public Records
Map
Nearby Homes
- 233 Cypress Ln W
- 227 Cypress Ln W
- 235 Cypress Ln W
- 223 Cypress Ln W
- 228 Cypress Ln W
- 232 Cypress Ln W
- 226 Cypress Ln W
- 234 Cypress Ln W
- 239 Cypress Ln W
- 221 Cypress Ln W
- 222 Cypress Ln W
- 238 Cypress Ln W
- 217 Cypress Ln W
- 241 Cypress Ln W
- 220 Cypress Ln W
- 12 Cottonwood Ln
- 8 Cottonwood Ln
- 16 Cottonwood Ln
- 242 Cypress Ln W
- 18 Cottonwood Ln