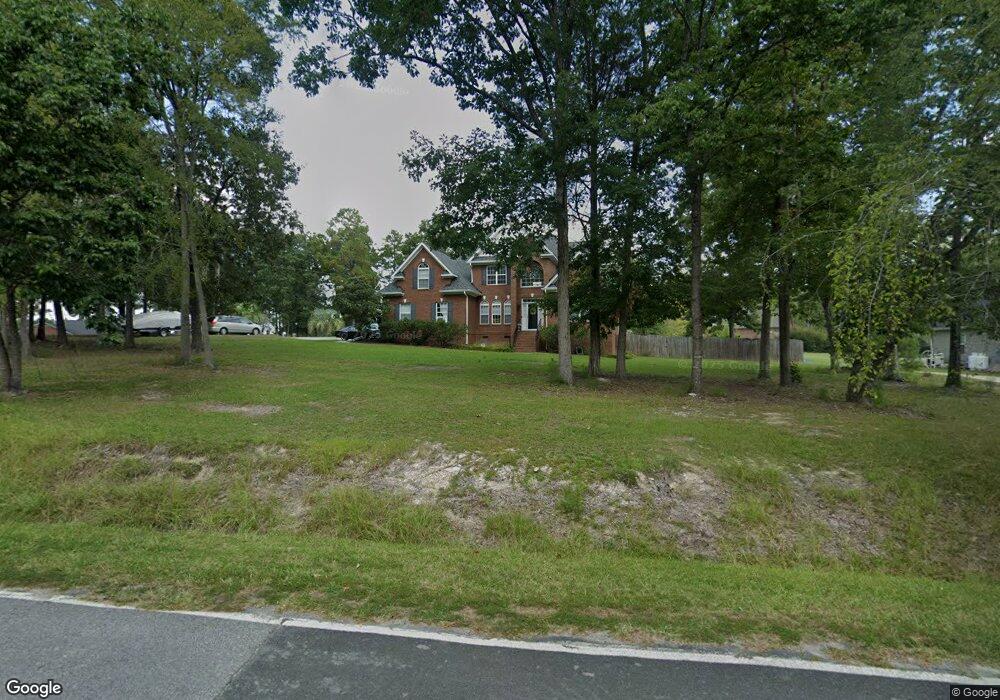
229 Dutchman Shores Cir Chapin, SC 29036
Estimated Value: $538,000 - $605,030
4
Beds
4
Baths
2,863
Sq Ft
$200/Sq Ft
Est. Value
About This Home
This home is located at 229 Dutchman Shores Cir, Chapin, SC 29036 and is currently estimated at $572,008, approximately $199 per square foot. 229 Dutchman Shores Cir is a home located in Lexington County with nearby schools including Chapin Elementary School, Chapin Intermediate, and Chapin High School.
Ownership History
Date
Name
Owned For
Owner Type
Purchase Details
Closed on
Dec 26, 2018
Sold by
Livingston Robert H and Livingston Jacquelline S
Bought by
Hartman Darryl and Hartman Carol
Current Estimated Value
Home Financials for this Owner
Home Financials are based on the most recent Mortgage that was taken out on this home.
Original Mortgage
$276,000
Outstanding Balance
$242,660
Interest Rate
4.6%
Mortgage Type
New Conventional
Estimated Equity
$329,348
Create a Home Valuation Report for This Property
The Home Valuation Report is an in-depth analysis detailing your home's value as well as a comparison with similar homes in the area
Home Values in the Area
Average Home Value in this Area
Purchase History
| Date | Buyer | Sale Price | Title Company |
|---|---|---|---|
| Hartman Darryl | $345,000 | None Available |
Source: Public Records
Mortgage History
| Date | Status | Borrower | Loan Amount |
|---|---|---|---|
| Open | Hartman Darryl | $276,000 |
Source: Public Records
Tax History Compared to Growth
Tax History
| Year | Tax Paid | Tax Assessment Tax Assessment Total Assessment is a certain percentage of the fair market value that is determined by local assessors to be the total taxable value of land and additions on the property. | Land | Improvement |
|---|---|---|---|---|
| 2024 | $1,904 | $13,800 | $1,800 | $12,000 |
| 2023 | $1,720 | $13,800 | $1,800 | $12,000 |
| 2022 | $1,749 | $13,800 | $1,800 | $12,000 |
| 2020 | $2,454 | $13,800 | $1,800 | $12,000 |
| 2019 | $2,269 | $13,800 | $2,520 | $11,280 |
| 2018 | $1,990 | $13,754 | $2,520 | $11,234 |
| 2017 | $1,939 | $13,754 | $2,520 | $11,234 |
| 2016 | $1,988 | $13,754 | $2,520 | $11,234 |
| 2014 | $1,808 | $12,547 | $1,552 | $10,995 |
| 2013 | -- | $12,550 | $1,550 | $11,000 |
Source: Public Records
Map
Nearby Homes
- 161 Dutchman Shores Cir
- 3006 Chilmark Rd
- 409 Dutchman Shores Cir
- 520 Walt Rauch Rd
- 342 Greengarden Dr
- 842 Misty Harbor Rd
- 119 Greengarden Dr
- 540 Lakeshore Dr
- 111 Greengarden Dr
- 0 Greengarden Dr Unit A 600737
- 0 Greengarden Dr Unit Q 601548
- 0 Greengarden Dr Unit T 601550
- 0 Greengarden Dr Unit P 600736
- 0 Greengarden Dr Unit U 600740
- 0 Greengarden Dr Unit 600735
- 0 Greengarden Dr Unit 620427
- 0 Greengarden Dr Unit W 600899
- 0 Greengarden Dr Unit V 600897
- 0 Greengarden Dr Unit 620425
- 0 Greengarden Dr Unit 620440
- 303 Dutchman Shores Cir
- 232 Dutchman Shores Cir
- 221 Dutchman Shores Cir
- 106 Lake Point Dr
- 100 Purgatory Point
- 101 Purgatory Point
- 228 Dutchman Shores Cir
- 309 Dutchman Shores Cir
- 224 Dutchman Shores Cir
- 310 Dutchman Shores Cir
- 220 Dutchman Shores Cir
- 103 Purgatory Point
- 215 Dutchman Shores Cir
- 216 Dutchman Shores Cir
- 110 Purgatory Point
- 316 Dutchman Shores Cir
- 210 Dutchman Shores Cir
- 314 Dutchman Shores Cir
- 321 Dutchman Shores Cir
- 107 Purgatory Point