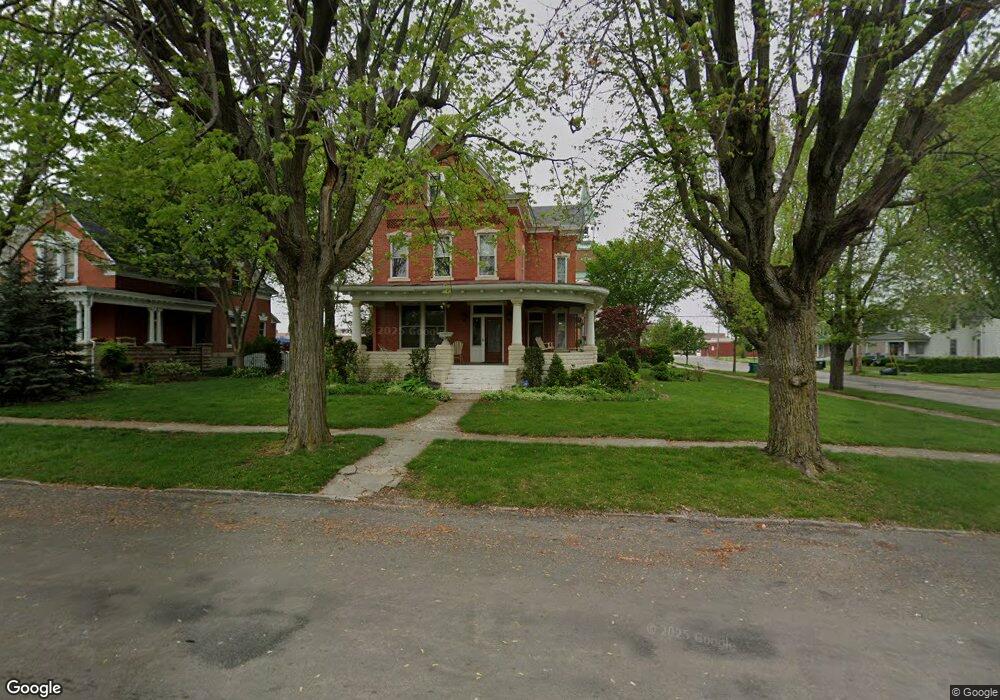
229 E 3rd St Delphos, OH 45833
Estimated Value: $138,000 - $294,000
4
Beds
2
Baths
2,864
Sq Ft
$80/Sq Ft
Est. Value
About This Home
This home is located at 229 E 3rd St, Delphos, OH 45833 and is currently estimated at $229,844, approximately $80 per square foot. 229 E 3rd St is a home located in Allen County with nearby schools including Delphos St. John's High School and Delphos St. John's Elementary School.
Ownership History
Date
Name
Owned For
Owner Type
Purchase Details
Closed on
May 3, 2011
Sold by
The Union Bank Company
Bought by
Mandryk Louis and Mandryk Louis C
Current Estimated Value
Home Financials for this Owner
Home Financials are based on the most recent Mortgage that was taken out on this home.
Original Mortgage
$45,000
Outstanding Balance
$31,114
Interest Rate
4.77%
Mortgage Type
New Conventional
Estimated Equity
$198,730
Purchase Details
Closed on
Jan 18, 2011
Sold by
Closson Jeffrey S and Closson Jeffrey S
Bought by
The Union Bank Company
Purchase Details
Closed on
Sep 14, 1995
Sold by
Strand Kevin
Bought by
Closson Jeffrey and Closson Sherri
Home Financials for this Owner
Home Financials are based on the most recent Mortgage that was taken out on this home.
Original Mortgage
$92,000
Interest Rate
7.75%
Mortgage Type
New Conventional
Purchase Details
Closed on
Sep 18, 1989
Bought by
Strand Kevin O
Create a Home Valuation Report for This Property
The Home Valuation Report is an in-depth analysis detailing your home's value as well as a comparison with similar homes in the area
Home Values in the Area
Average Home Value in this Area
Purchase History
| Date | Buyer | Sale Price | Title Company |
|---|---|---|---|
| Mandryk Louis | $56,300 | Attorney | |
| The Union Bank Company | $50,000 | None Available | |
| Closson Jeffrey | $115,000 | -- | |
| Strand Kevin O | $72,300 | -- |
Source: Public Records
Mortgage History
| Date | Status | Borrower | Loan Amount |
|---|---|---|---|
| Open | Mandryk Louis | $45,000 | |
| Previous Owner | Closson Jeffrey | $92,000 |
Source: Public Records
Tax History
| Year | Tax Paid | Tax Assessment Tax Assessment Total Assessment is a certain percentage of the fair market value that is determined by local assessors to be the total taxable value of land and additions on the property. | Land | Improvement |
|---|---|---|---|---|
| 2024 | $2,867 | $93,420 | $11,170 | $82,250 |
| 2023 | $2,252 | $69,720 | $8,330 | $61,390 |
| 2022 | $2,308 | $69,720 | $8,330 | $61,390 |
| 2021 | $2,319 | $69,720 | $8,330 | $61,390 |
| 2020 | $1,948 | $61,080 | $7,950 | $53,130 |
| 2019 | $1,948 | $61,080 | $7,950 | $53,130 |
| 2018 | $1,900 | $61,080 | $7,950 | $53,130 |
| 2017 | $1,823 | $56,250 | $7,950 | $48,300 |
| 2016 | $1,836 | $56,250 | $7,950 | $48,300 |
| 2015 | $1,722 | $56,250 | $7,950 | $48,300 |
| 2014 | $1,722 | $52,080 | $7,630 | $44,450 |
| 2013 | $1,726 | $52,080 | $7,630 | $44,450 |
Source: Public Records
Map
Nearby Homes
- 201 E 5th St
- 610 N Washington St
- 221 S Main St
- 629 N Main St
- 821 E 3rd St
- 424 S Canal St
- 409 N Bredeick St
- 483 S Franklin St
- 709 W 4th St
- 537 / 539 Toomey
- 827 S Washington St
- 10429 Ohio 66
- 241 King St
- 1000 Colettas Way
- 7110 Elida Rd
- 6800 N Defiance Trail
- 8448 Elida Rd
- 523 E Jackson St
- 112 W Railroad St
- 608 N Adams St
Your Personal Tour Guide
Ask me questions while you tour the home.