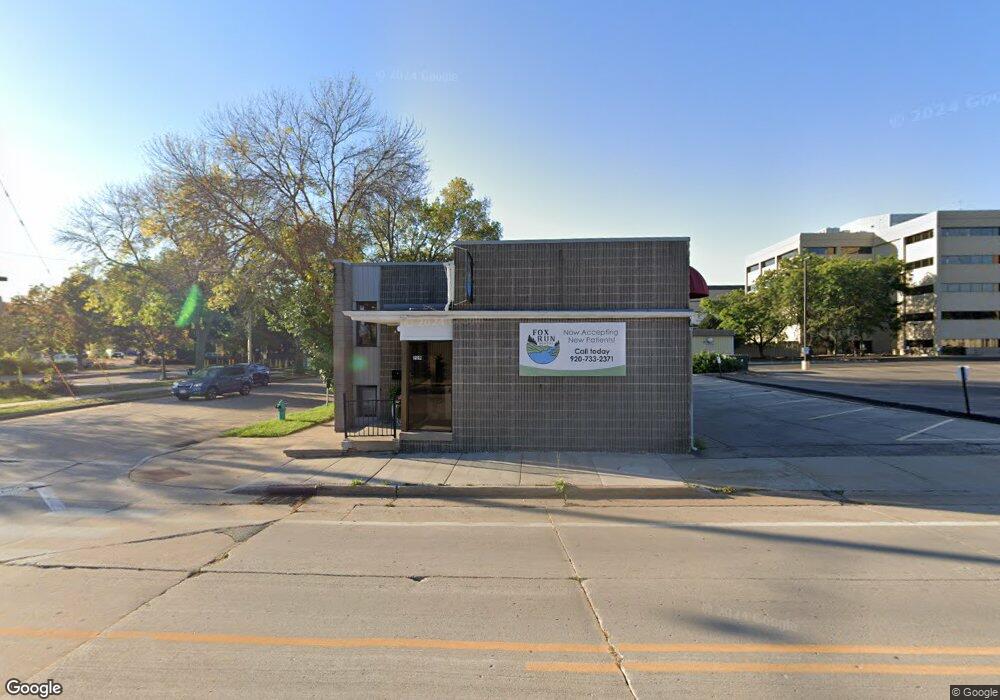
229 E Franklin St Appleton, WI 54911
Downtown Appleton NeighborhoodEstimated Value: $235,678
Studio
--
Bath
1,758
Sq Ft
$134/Sq Ft
Est. Value
About This Home
This home is located at 229 E Franklin St, Appleton, WI 54911 and is currently estimated at $235,678, approximately $134 per square foot. 229 E Franklin St is a home located in Outagamie County with nearby schools including Edison Elementary School, Appleton North High School, and Appleton Bilingual School.
Ownership History
Date
Name
Owned For
Owner Type
Purchase Details
Closed on
Oct 11, 2022
Sold by
Detweiler Allen D
Bought by
Detweiler Properties Llc
Current Estimated Value
Home Financials for this Owner
Home Financials are based on the most recent Mortgage that was taken out on this home.
Original Mortgage
$220,000
Interest Rate
5.3%
Mortgage Type
New Conventional
Purchase Details
Closed on
Aug 19, 2022
Sold by
Ethel Conner Llc
Bought by
Conner Ethel M
Home Financials for this Owner
Home Financials are based on the most recent Mortgage that was taken out on this home.
Original Mortgage
$220,000
Interest Rate
5.3%
Mortgage Type
New Conventional
Purchase Details
Closed on
Aug 17, 2022
Sold by
Conner Ethel M
Bought by
Detweller Allen D
Home Financials for this Owner
Home Financials are based on the most recent Mortgage that was taken out on this home.
Original Mortgage
$220,000
Interest Rate
5.3%
Mortgage Type
New Conventional
Create a Home Valuation Report for This Property
The Home Valuation Report is an in-depth analysis detailing your home's value as well as a comparison with similar homes in the area
Home Values in the Area
Average Home Value in this Area
Purchase History
| Date | Buyer | Sale Price | Title Company |
|---|---|---|---|
| Detweiler Properties Llc | -- | -- | |
| Conner Ethel M | -- | None Listed On Document | |
| Detweller Allen D | $274,000 | First American Title Insurance |
Source: Public Records
Mortgage History
| Date | Status | Borrower | Loan Amount |
|---|---|---|---|
| Previous Owner | Detweller Allen D | $220,000 |
Source: Public Records
Tax History
| Year | Tax Paid | Tax Assessment Tax Assessment Total Assessment is a certain percentage of the fair market value that is determined by local assessors to be the total taxable value of land and additions on the property. | Land | Improvement |
|---|---|---|---|---|
| 2024 | $4,149 | $273,500 | $75,500 | $198,000 |
| 2023 | $4,386 | $273,500 | $75,500 | $198,000 |
| 2022 | $4,096 | $190,000 | $65,000 | $125,000 |
| 2021 | $4,443 | $190,000 | $65,000 | $125,000 |
| 2020 | $3,842 | $190,000 | $65,000 | $125,000 |
| 2019 | $3,757 | $190,000 | $65,000 | $125,000 |
| 2018 | $4,287 | $190,000 | $65,000 | $125,000 |
| 2017 | $4,097 | $185,000 | $65,000 | $120,000 |
| 2016 | $4,502 | $185,000 | $65,000 | $120,000 |
| 2015 | $4,549 | $185,000 | $65,000 | $120,000 |
| 2014 | $4,057 | $185,000 | $65,000 | $120,000 |
| 2013 | $4,063 | $185,000 | $65,000 | $120,000 |
Source: Public Records
Map
Nearby Homes
- 526 N Ida St
- 818 N Durkee St
- 221 E Winnebago St
- 827 E Washington St
- 324 E Commercial St
- 400 N Richmond St Unit 328
- 400 N Richmond St Unit 417
- 501 W Winnebago St
- 431 E Summer St
- 425 E Summer St
- 913 N Harriman St
- 1 Brokaw Place
- 614 W 6th St
- 1702 S Perkins St
- 1606 S Carver Ln
- 736 W 8th St
- 731 W Elsie St
- 515 N Tonka St
- 739 W 8th St
- 730 W Oklahoma St
- 288 N Morrison St
- 280 N Morrison St
- 270 N Morrison St
- 260 N Morrison St
- 322 N Morrison St
- 252 N Morrison St
- 326 N Morrison St
- 297 N Morrison St
- 289 N Morrison St
- 334 N Morrison St
- 281 N Morrison St
- 338 N Morrison St
- 342 N Morrison St
- 271 N Morrison St
- 261 N Morrison St
- 350 N Morrison St
- 315 N Morrison St
- 321 N Morrison St
- 253 N Morrison St
- 325 N Morrison St
Your Personal Tour Guide
Ask me questions while you tour the home.