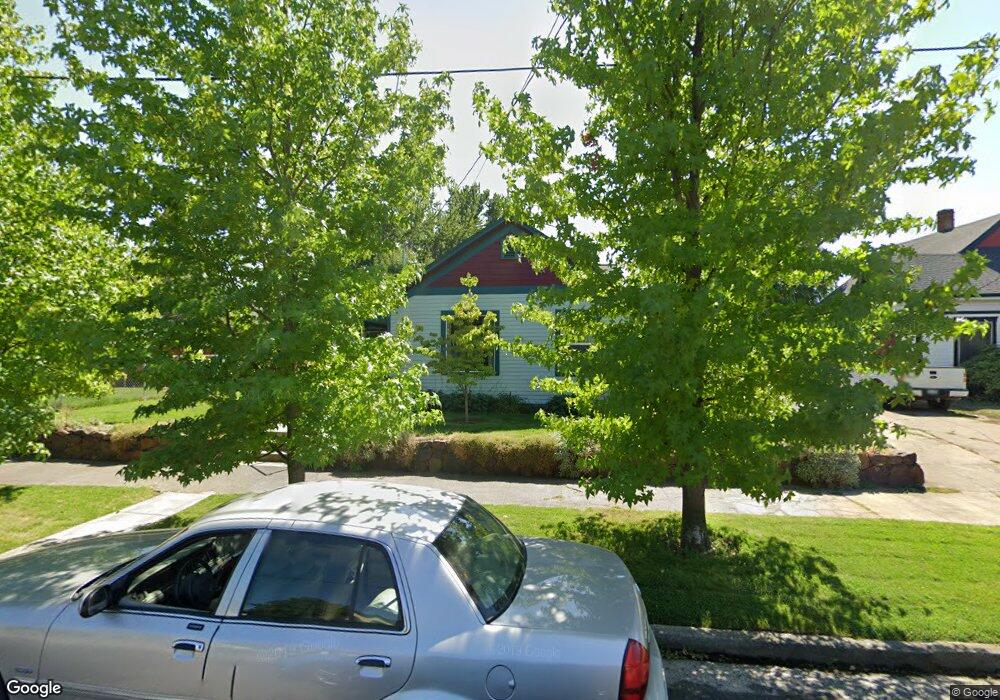
229 Eagan St Walla Walla, WA 99362
Estimated Value: $313,000 - $469,000
3
Beds
2
Baths
1,452
Sq Ft
$284/Sq Ft
Est. Value
About This Home
This home is located at 229 Eagan St, Walla Walla, WA 99362 and is currently estimated at $411,743, approximately $283 per square foot. 229 Eagan St is a home located in Walla Walla County with nearby schools including Sharpstein Elementary School, Garrison Middle School, and Willow Public School.
Ownership History
Date
Name
Owned For
Owner Type
Purchase Details
Closed on
May 19, 2009
Sold by
Davis Michael and Davis Krista
Bought by
Rhodes David and Rhodes Cecile
Current Estimated Value
Purchase Details
Closed on
May 1, 2007
Sold by
Gregg Clayton W
Bought by
Davis Mike and Davis Krista
Home Financials for this Owner
Home Financials are based on the most recent Mortgage that was taken out on this home.
Original Mortgage
$146,160
Interest Rate
6.14%
Mortgage Type
New Conventional
Create a Home Valuation Report for This Property
The Home Valuation Report is an in-depth analysis detailing your home's value as well as a comparison with similar homes in the area
Purchase History
| Date | Buyer | Sale Price | Title Company |
|---|---|---|---|
| Rhodes David | $353,118 | Land Title Of Walla Walla Co | |
| Davis Mike | $183,026 | Land Title Of Walla Walla Co |
Source: Public Records
Mortgage History
| Date | Status | Borrower | Loan Amount |
|---|---|---|---|
| Previous Owner | Davis Mike | $146,160 |
Source: Public Records
Tax History
| Year | Tax Paid | Tax Assessment Tax Assessment Total Assessment is a certain percentage of the fair market value that is determined by local assessors to be the total taxable value of land and additions on the property. | Land | Improvement |
|---|---|---|---|---|
| 2025 | $4,122 | $416,330 | $76,880 | $339,450 |
| 2024 | $3,260 | $416,330 | $76,880 | $339,450 |
| 2023 | $3,260 | $368,020 | $49,220 | $318,800 |
| 2022 | $2,970 | $352,840 | $49,220 | $303,620 |
| 2021 | $2,829 | $274,120 | $49,220 | $224,900 |
| 2020 | $2,796 | $236,640 | $49,220 | $187,420 |
| 2019 | $2,558 | $236,640 | $49,220 | $187,420 |
| 2018 | $3,112 | $236,640 | $49,220 | $187,420 |
| 2017 | $2,674 | $235,690 | $46,600 | $189,090 |
| 2016 | $2,811 | $218,500 | $46,600 | $171,900 |
| 2015 | $2,751 | $218,500 | $46,600 | $171,900 |
| 2014 | -- | $218,500 | $46,600 | $171,900 |
| 2013 | -- | $218,500 | $46,600 | $171,900 |
Source: Public Records
Map
Nearby Homes
- 249 Eagan St
- 444 S 4th Ave
- 419 Chase Ave
- 618 S 2nd Ave
- 201 Malcolm St
- 8 Newell St
- 564 S 1st Ave
- 124 Whitman St
- 130 Dice Place
- 364 Catherine St Unit S10
- 622 W Poplar St
- 310 S 10th Ave
- 123 E Maple St
- 902 Emma St
- 703 W Main St
- 366 S Palouse St
- 1014 W Chestnut St
- 1002 W Poplar St
- 309 E Birch St
- 1204 S 2nd Ave
Your Personal Tour Guide
Ask me questions while you tour the home.