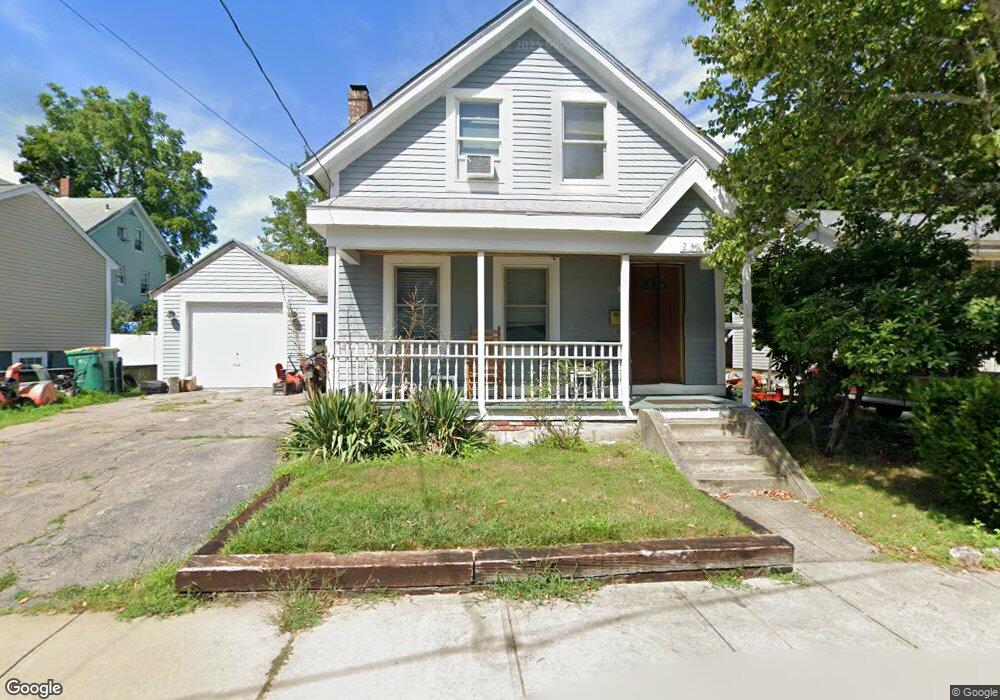
229 East St North Attleboro, MA 02760
North Attleboro NeighborhoodEstimated Value: $364,000 - $431,000
3
Beds
1
Bath
990
Sq Ft
$392/Sq Ft
Est. Value
About This Home
This home is located at 229 East St, North Attleboro, MA 02760 and is currently estimated at $387,957, approximately $391 per square foot. 229 East St is a home located in Bristol County with nearby schools including North Attleboro High School and Bishop Feehan High School.
Ownership History
Date
Name
Owned For
Owner Type
Purchase Details
Closed on
Jul 30, 2003
Sold by
Rogers Cindy Jo and Rogers Cindy
Bought by
Rogers Cindy Jo and Rogers Daniel D
Current Estimated Value
Home Financials for this Owner
Home Financials are based on the most recent Mortgage that was taken out on this home.
Original Mortgage
$140,000
Outstanding Balance
$60,122
Interest Rate
5.28%
Estimated Equity
$327,835
Purchase Details
Closed on
Aug 30, 1996
Sold by
Moore Shana L and Moore Paul J
Bought by
Rogers Daniel D and Rogers Cindy
Home Financials for this Owner
Home Financials are based on the most recent Mortgage that was taken out on this home.
Original Mortgage
$103,000
Interest Rate
8.18%
Purchase Details
Closed on
Oct 19, 1993
Sold by
Broderick Thomas F and Broderick Ann Marie
Bought by
Moore Shana L and Moore Paul J
Create a Home Valuation Report for This Property
The Home Valuation Report is an in-depth analysis detailing your home's value as well as a comparison with similar homes in the area
Home Values in the Area
Average Home Value in this Area
Purchase History
| Date | Buyer | Sale Price | Title Company |
|---|---|---|---|
| Rogers Cindy Jo | -- | -- | |
| Rogers Daniel D | $103,000 | -- | |
| Moore Shana L | $81,000 | -- |
Source: Public Records
Mortgage History
| Date | Status | Borrower | Loan Amount |
|---|---|---|---|
| Open | Rogers Cindy Jo | $140,000 | |
| Previous Owner | Moore Shana L | $102,672 | |
| Previous Owner | Moore Shana L | $103,650 | |
| Previous Owner | Moore Shana L | $103,000 |
Source: Public Records
Tax History Compared to Growth
Tax History
| Year | Tax Paid | Tax Assessment Tax Assessment Total Assessment is a certain percentage of the fair market value that is determined by local assessors to be the total taxable value of land and additions on the property. | Land | Improvement |
|---|---|---|---|---|
| 2025 | $3,577 | $303,400 | $75,600 | $227,800 |
| 2024 | $3,407 | $295,200 | $75,600 | $219,600 |
| 2023 | $3,355 | $262,300 | $75,600 | $186,700 |
| 2022 | $3,260 | $234,000 | $71,800 | $162,200 |
| 2021 | $3,094 | $216,800 | $68,000 | $148,800 |
| 2020 | $3,006 | $209,500 | $64,200 | $145,300 |
| 2019 | $2,777 | $195,000 | $58,400 | $136,600 |
| 2018 | $2,399 | $179,800 | $54,900 | $124,900 |
| 2017 | $2,179 | $164,800 | $51,500 | $113,300 |
| 2016 | $2,146 | $162,300 | $68,700 | $93,600 |
| 2015 | $1,980 | $150,700 | $68,700 | $82,000 |
| 2014 | $2,047 | $154,600 | $64,500 | $90,100 |
Source: Public Records
Map
Nearby Homes
- 68 Fisher St
- 64 Smith St
- 20 South St
- 633 E Washington St Unit 10
- 8 Al Pace Dr Unit 8
- 19 Church St Unit A5
- 212 Fisher St Unit A5
- 35-R Whiting St
- 16 Richards Ave Unit 106
- 217 Fisher St
- 0 Landry 2nd Unit 73350867
- 880 Landry Ave Unit 2
- 85 Richards Ave
- 42 2nd Ave Unit 24
- 45 Moran St
- 93 Bank St
- 1066 Mount Hope St
- 20 Holbrook Ave
- 58 Jay St
- 99 Arnold Rd
- 231 East St
- 225 East St
- 225 East St Unit 2
- 215 N Washington St
- 211 N Washington St
- 219 N Washington St
- 227 East St
- 1 Riley Ct
- 223 East St
- 223 East St Unit 1
- 223 East St Unit 2
- 240 East St
- 223 N Washington St
- 2 Riley Ct
- 219 East St
- 214 N Washington St
- 300 East St Unit 8 E
- 229 N Washington St
- 215 East St
- 189 N Washington St