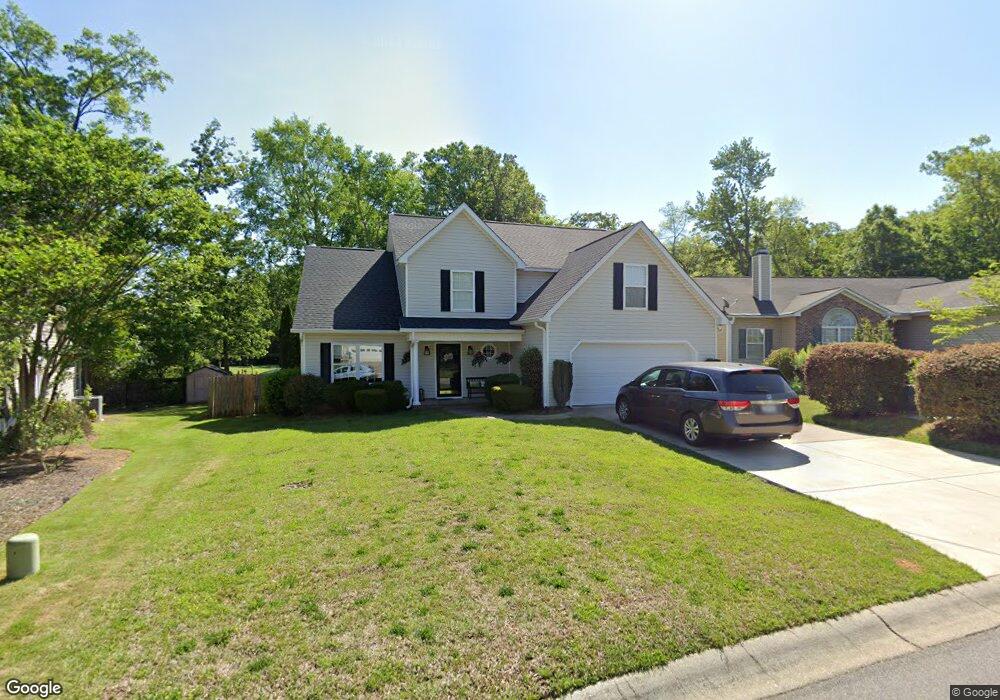
229 Elm Creek Ct Chapin, SC 29036
Estimated Value: $287,000 - $300,000
4
Beds
3
Baths
2,257
Sq Ft
$130/Sq Ft
Est. Value
About This Home
This home is located at 229 Elm Creek Ct, Chapin, SC 29036 and is currently estimated at $293,861, approximately $130 per square foot. 229 Elm Creek Ct is a home located in Lexington County with nearby schools including Chapin Elementary School, Chapin Intermediate, and Chapin High School.
Ownership History
Date
Name
Owned For
Owner Type
Purchase Details
Closed on
Nov 7, 2019
Sold by
Smith Amy J and Smith Christopher S
Bought by
Lopes Berry Lisa B and Berry James L
Current Estimated Value
Home Financials for this Owner
Home Financials are based on the most recent Mortgage that was taken out on this home.
Original Mortgage
$174,775
Outstanding Balance
$157,721
Interest Rate
4.99%
Mortgage Type
FHA
Estimated Equity
$136,140
Purchase Details
Closed on
Jun 19, 2009
Sold by
Junkersfeld Ruby A and Pierson Warren B
Bought by
Smith Christopher S and Smith Amy J
Home Financials for this Owner
Home Financials are based on the most recent Mortgage that was taken out on this home.
Original Mortgage
$166,822
Interest Rate
4.79%
Mortgage Type
FHA
Purchase Details
Closed on
Jun 30, 2005
Sold by
Bb & B Builders Inc
Bought by
Junkersfeld Ruby A and Pierson Warren B
Home Financials for this Owner
Home Financials are based on the most recent Mortgage that was taken out on this home.
Original Mortgage
$129,900
Interest Rate
5.54%
Mortgage Type
New Conventional
Create a Home Valuation Report for This Property
The Home Valuation Report is an in-depth analysis detailing your home's value as well as a comparison with similar homes in the area
Home Values in the Area
Average Home Value in this Area
Purchase History
| Date | Buyer | Sale Price | Title Company |
|---|---|---|---|
| Lopes Berry Lisa B | $178,000 | None Available | |
| Smith Christopher S | $169,900 | -- | |
| Junkersfeld Ruby A | $164,900 | -- |
Source: Public Records
Mortgage History
| Date | Status | Borrower | Loan Amount |
|---|---|---|---|
| Open | Lopes Berry Lisa B | $174,775 | |
| Previous Owner | Smith Christopher S | $166,822 | |
| Previous Owner | Junkersfeld Ruby A | $129,900 |
Source: Public Records
Tax History Compared to Growth
Tax History
| Year | Tax Paid | Tax Assessment Tax Assessment Total Assessment is a certain percentage of the fair market value that is determined by local assessors to be the total taxable value of land and additions on the property. | Land | Improvement |
|---|---|---|---|---|
| 2024 | $1,173 | $7,120 | $1,000 | $6,120 |
| 2023 | $1,089 | $7,120 | $1,000 | $6,120 |
| 2020 | $1,266 | $7,120 | $1,000 | $6,120 |
| 2019 | $1,094 | $6,651 | $1,000 | $5,651 |
| 2018 | $963 | $6,651 | $1,000 | $5,651 |
| 2017 | $938 | $6,651 | $1,000 | $5,651 |
| 2016 | $961 | $6,651 | $1,000 | $5,651 |
| 2014 | $980 | $6,795 | $1,200 | $5,595 |
| 2013 | -- | $6,800 | $1,200 | $5,600 |
Source: Public Records
Map
Nearby Homes
- 129 Monroe Preserve Dr
- 0 Mainsail Ln Unit 622256
- 0 Dreher Island Rd Unit 21647709
- 0 Dreher Island Rd Unit 587193
- 153 Rushton Dr
- 1533 Saugus Ct
- 814 Dutchmaster Dr
- 1431 Saugus Ct
- 100 Palm St
- 147 Stuck's Point
- 117 Bay Front Dr
- 228 Bickley View Ct
- 125 Northshore Dr
- 412 Northshore Ct
- 417 Northshore Ct
- 510 Lilypad Ct
- 357 Chapin Place Way
- 358 Chapin Place Way
- 354 Chapin Place Way
- 338 Chapin Place Way
- 233 Elm Creek Ct
- 225 Elm Creek Ct
- tbd Resting Place
- 221 Elm Creek Ct
- 237 Elm Creek Ct
- 198 Elm Creek Dr
- 230 Elm Creek Ct
- 217 Elm Creek Ct
- 236 Elm Creek Ct
- 241 Elm Creek Ct
- 224 Elm Creek Ct
- 242 Elm Creek Ct
- 194 Elm Creek Dr
- 218 Elm Creek Ct
- 195 Elm Creek Dr
- 213 Elm Creek Ct
- 2409 Hadley Crossing
- 2367 Hadley Crossing
- 245 Elm Creek Ct
- 212 Elm Creek Ct